The Curious Case of Mikel Arteta
17 Apr 2021

When Arsenal hosted Liverpool on the 3rd of April 2021 at the Emirates, it would be Mikel Arteta’s 50th game in charge. The jury is still out on Arteta’s suitability for the role, with opinions on whether he is the right man for Arsenal generally split across the fanbase.
Going into the game, Arsenal were a somewhat in-form team after a crucial North London Derby victory over Tottenham Hotspur, and a morale boosting 3-3 comeback draw against a revitalized West Ham United outfit. The Liverpool side, who were nowhere near the highs of their Premier League and Champions League winning seasons, were there for the taking. Eventually, the Gunner’s insipid performance led to a humbling 3-0 loss, mustering a total of 0.09 xG (Expected Goals), of which 0.06 came from an offside attempt. Arsenal now sit 10th, 9 points off a European spot with the same number of wins and losses (12).
This performance succinctly summarized the kind of season Arsenal has had. It has been a roller coaster ride for Arsenal fans, with the Gunner’s Jekyll and Hyde performance delivering some memorable performances and even more frustrating ones. At times, it feels like certain performances can be determined by a 50-50 coin flip – you just never know which team is going to turn up!
The key question remains – is Arteta the right man for the job? Has he brought back (or is bringing back) an identity to the football club which was once synonymous with attractive attacking football?
In my attempt to answer such questions in the midst of the 2nd and 3rd lockdown here in the UK, I decided to turn to the data to see if they would tell me anything interesting. The data used in the following visualisations were scraped from whoscored.com and plots were visualised using Python (you can check out my rather messy code on my Github profile!). In this initial post, I will be introducing and discussing the use of passing networks to evaluate team performances. Subsequently, in my attempt to dethrone Jamie Carragher and Gary Neville from Sky Sports Monday Night Football, I will utilise my far from professional football knowledge and plots to assess Arteta’s performance.
Passing Networks
As the most fundamental and abundant action in a football game, passes are a perhaps a great initial way to evaluate the effectiveness of a team’s tactics. This is where passing networks bring in so much value as a simple illustration that can include many levels of dimensionality. This helps unveil crucial information on the organization of players (eg. Are there certain stronger partnerships on the team?) and evaluating player’s performances.

Football passing networks are constructed by observing the number of passes made between any 2 players of a team. Let’s look at an example passing network from the West Brom vs Arsenal game (I chose this because it was one of the more memorable Arsenal performances this season) above. In this diagram, the selected team (Arsenal) is attacking from left to right on a pitch bounded between \([0,100]\) coordinates on both the x and y axis. Each node corresponds to one of the 11 player’s position on the pitch. This is derived by calculating the median position of each player’s position on the pitch when a successful pass is made. The thickness of the lines (edges) between nodes represents the number of successful passes made between the 2 players. The size of the node itself represents the number of successful passes made by that player. Such a simple graphic can shed light on a team’s tactic and derive valuable insights such as:
- Eigenvalue centrality – which player or players are crucial for the network. Players with larger nodes are more involved in the teams build up play
- Identifying crucial partnerships - Which partnerships are crucial to a team’s build up? We can identify important passing lanes in the team by seeing which pair has the most passes between them.
- Average position on the pitch How advanced are the players on the pitch? Generally, more attacking teams have their player’s median position closer to the opposition’s box while defensive teams are packed closer to the back.
- Overall gameplan – Is the team’s tactic to build up slowly from the back, to get the ball to the wingers or full backs and attack the oppositions wing, or to hoof it up the field to a target man? Passing maps help to visualise this by identifying if passing nodes are highly skewed to a specific part of the pitch.
This list is by no means comprehensive, and there are so many more dimensions we can add to these networks to derive even more valuable insights.
All passes are equal, but some more than others
The usefulness of these maps can start to be limited as we start to demand more in-depth analysis of the game. One thing that strikes from analysing the passing network is the value and quality of a pass. In the above diagram, each successful pass is regarded as having the same value (1) and contributes equally to the size of the nodes. In reality, this is not the case – a simple 5 yard ground pass does not add the same value to a team’s build up play as compared to a 40 yard defense splitting through ball to put your striker in pole position to score. Teams with a focus on a slow build up from the back also tend to have more passes between the back 4 and the goalkeeper as compared to the rest of the players, and this is where we see skewed passing networks where the main passing nodes are the defenders. Passes between the defenders tend to be much shorter, more risk-free and unpressured as opposed to passes made up the pitch where attackers will have multiple opposition players closing down rapidly. There needs to be a way to reward passes based on how much value they can add to the buildup. In this instance, a good proxy of ‘rewarding’ these passes would be if these passes would help to increase the team’s probability of scoring.
Expected Goals (xG) and Expected Threat (xT)
Expected Goals (xG) is a well-known metric in the footballing community to measure the effectiveness of a team’s attack during the game. As football is such a low scoring game, the final score does not necessarily provide the full narrative of the game. xG was introduced as a statistical tool to measure the quality of chances created. This helps to build a narrative of the game where the team with higher xG in the match produced more quality chances and on the balance deserve to win the game. This involves building a Logistics Regression model based on historical shots and probability of them resulting in a goal. However, xG only measures the shots quality of a team. What about the actions that led to the creation of a chance? Or even actions that substantially improved a team’s chance of scoring but did not end up with a shot?
For this, I will have to thank Karun Singh for conceiving the idea of Expected Threat (xT). xT builds on the pure-shot model of xG to analyse the effectiveness of one’s buildup play. The idea involves breaking down the pitch into a 12 by 8 grid and deriving an xT value in each area.
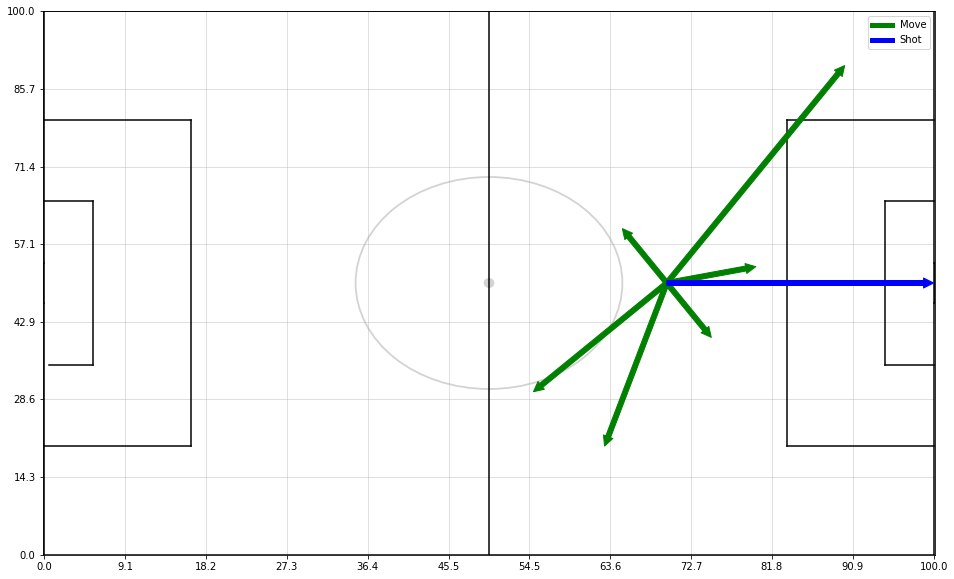
xT is predominantly made of 2 parts – one is the expected payoff (probability of scoring for simplicity) from shooting from that position while the other is a summation of payoffs of moving the ball to another location on the pitch and subsequently scoring from those positions. As seen above, at a point \([70,50]\), a player has the option to either move the ball (green) or shoot(blue) from that position. xT sums up the total threat made from moving the ball to each of the other 95 grids on the pitch and the probability of scoring from that position (xG). xT metric rewards the player for progressing the ball into a more advanced position where there is a higher probability of scoring, whilst penalising him if a pass resulted in a lower probability of scoring. For more details, check out my other post here on a bit more detail on xT derivation, and of course Karun’s awesome blogpost.

I will be incorporating the xT values Karun has kindly provided from the 2017-2018 Premier League season. The results are visualised on a 12 x 8 grid diagram above. This intuitively makes sense as a position closer to the opposition goal should have a higher xT associated.
A new dimension - xT weighted passing networks
With the xT values, we are now able to include an additional dimension to the passing network. The total xT generated per player was calculated by summing all successful passes made by that player. This total xT value is represented by the colour of the nodes. The colour scales are weighted from lighter to darkest with increasing xT values. Here we can see how the xT weighted passing network appears for the same game:

We can see that Saka was the immediate stand out performer despite having less passes than his colleagues. His average position on the pitch was also much more advanced compared to the others. Saka’s constant threat down the right flank this game yielded a goal along with a shout for a Man of the Match performance. We can also see Arsenal’s reliance on full backs Kieran Tierney and Hector Bellerin to attack as their positions were more advanced than the 2 midfielders. Tierney was particularly influential on the left flank, scoring a worldie and provided an assist to Alexandre Lacazette from the left flank. In this match, Arsenal’s game plan of threats along the flank worked out supremely well as they emerged as 4-0 victors. We can now see the effectiveness of such a passing map to evaluate and analyse a team’s attack.
xT is just one of the many footballing metrics out there being developed. The football analytics space is rapidly growing, with many analytics teams coming up with innovative ways to evaluate players performances, analyse team performances to give their clubs an edge. Other metrics include Valuing Actions by Estimating Probability (VAEP) framework which involves assigning a value to each on the ball movement and analysing its impact on the outcome of the game.
In conclusion
To answer the initial question I posed- much more analysis has to be conducted to grade Arteta’s performance but time is running out for him to turn the tide to his favour. He sorely needs something to change and bring in a good string of results to avoid a complete fan revolt come end of season.
Hopefully this post will provide a rather quick insight on the importance of passing maps and how dynamic they get when we add different dimensions like xT into the fray! Stay tuned for more!