18 Nov 2022

All credits of this image goes to The Analyst.
In what would be Ronaldo and Messi’s last World Cup, who will emerge victorious? Will someone else clinch glory leaving these 2 players without the coveted trophy? In this controversial FIFA World Cup, where the tournament takes place in between the regular club season and in the winter months, the key question on everyone’s mind is what other surprises can this World Cup bring?
Politics aside on where and how the World Cup is being hosted, lets put the focus back on football itself. After a long absence from playing with football data, I am back with fresh new ideas to predict and simulate the World Cup games!
If you have been following me from my posts back in the Euros, you will remember that I used a modified xG metric to build a poisson product matrix to determine the most likely outcome and results of a match between 2 teams (If not I recommend giving this post a read). This time, I utilised a modified approach which layers on the xG analysis done previously to simulate the entire tournament.
Methodology
This method involves predicting the future value of xG using Generalised Estimating Equations. A generalized estimating equation is a method of estimating parameters with the assumption that there is a dependence within clusters or groups. The model accounts for a within-subject correlation of responses on dependent variables which is essentially a \(TxT\) matrix. The type of distribution specified here is Poisson as we have studied previously that the distribution of goals (and xG) do follow a Poisson distribution. For more information on GEE, check out this github page post by Johnny Hong and Kellie Ottoboni here.
In the case of predicting football scores, the assumption is that there is a strong dependence of the xG generated per team and the opposition that they are facing. This intuitively makes sense as a team will more likely generate a greater xG playing against a weaker opposition versus a stronger opposition. In this analysis, each cluster/group will be a single match as the xG generated within the game is very much dependent on the opposition team.
The method mentioned above was first employed by Vladimir Dzyuba here with some modifications which I have introduced.
Elo Rankings
The Elo rating was developed for use in chess to rank and calculate the relative skill level of players by Dr Arpad Elo. It was used to predict the outcome of the match simply by measuring the ranking/rating of the chess players. Gradually its influence spread across to new sports like tennis, baseball and football.
The World Football Elo Ratings was developed and published on Eloratings.net and this will serve as our data source for our predictions. The Elo rating is based on the following formula:
\[R_{n} = R_{o} + K \times (W - W_{e})\]
- \(R_{n}\) is the new rating
- \(R_{o}\) is the current rating (before the match is played)
- \(K\) is the weight constant depending on the the tournament to match is played in (higher weight given to more important tournaments). K is then further adjusted based on the goal difference in the game.
- \(W\) is the outcome of the game - 1 for a win, 0.5 for a draw and 0 for a loss.
- \(W_{e}\) is the expected result (win expectancy) from the formula \(W_{e} = 1/(10^{-dr/400} + 1)\) and \(dr\) equals the difference in ratings plus 100 points for a team playing at home.
The match looks complicated at first glance but in essence, the rating is recalculated after every game based on the whether the team has won, against who and by how much. For example, a victory against a weaker team with a smaller goal difference will result in a smaller increase in the Elo Rating as compared to a large victory against a significantly stronger team.
Data
Elo ratings were extracted from Eloratings.net and are updated as of 1 November 2022.
The xG values and goals scored per team were kindly provided by footystats.org. As there is this correlation between the elo rating and the xG / goals scored, it was essential that not too historic match data was used as that may otherwise may not be reflective of a team’s recent performances. Therefore, only data from all tournaments (international friendlies, regional cup competitions and qualifiers) since 2019 have been used. In total there are about 2,500 matches worth of training data.
Building the GEE model
With the xG and goals scored data, the training dataset for the GEE model can be constructed. A simple dataframe containing teams, opposition and the xG generated for the team was built after loads of data cleansing (removing cancelled matches, etc.). Each match generates 2 rows as in the example: Team A (xG = 2.15) vs Team B (xG = 1.2)
| Team |
Opposition |
xG |
| Team A |
Team B |
2.15 |
| Team B |
Team A |
1.2 |
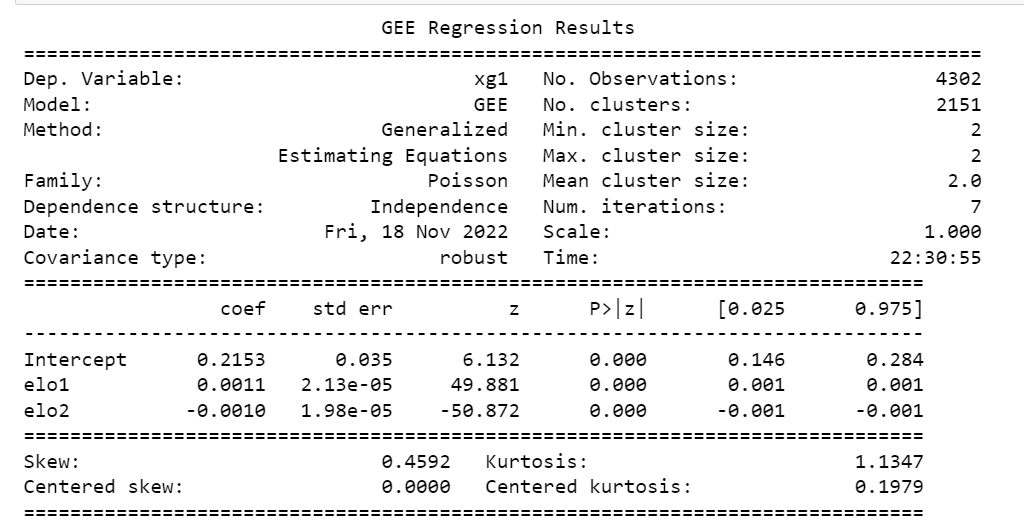
The xG prediction model was built using the statsmodel python package which already contains the in-built statistics tools to build the prediction model. Here are the results of the model:
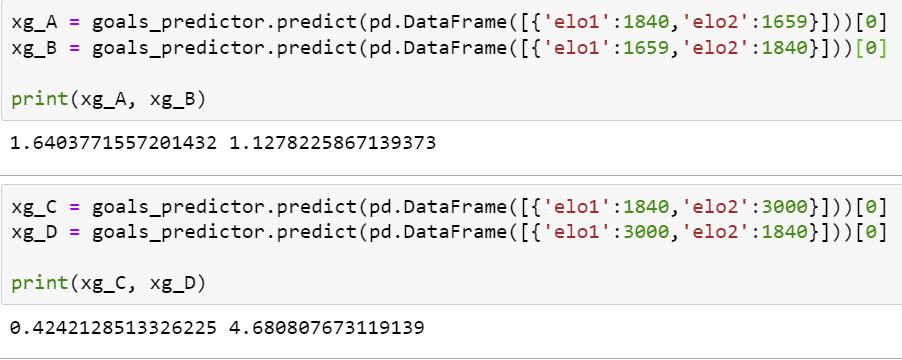
The model ran with 7 iterations with a cluster size of 2 (team and oppposition). By running a few test predictions, it also validated the assumption that a team will generate greater xG and concede less xG against a lower rated Elo rating team as compared to a higher rated team (phew!).
Deciding the winners, losers and most probable outcome
Now with the ability to determine the expected goals given a team-opposition pair, we can now construct a win probability matrix per match. This is similar to the analysis performed in my Euro predictions where the product of two probability mass functions (Poisson distribution) is used to determine a probability of the match score outcome. An example of one the games - England vs Iran can be shown below. The green section indicates the probability of an Iran victory, the red section is the probability of an England victory, and the amber section indicates a draw.
| England goals ↓/ Iran Goals → |
0 |
1 |
2 |
3 |
4 |
5 |
| 0 |
6.37% |
7.85% |
4.84% |
1.98% |
0.61% |
0.15% |
| 1 |
9.69% |
11.9% |
7.35% |
3.02% |
0.93% |
0.15% |
| 2 |
7.38% |
9.08% |
5.59% |
2.30% |
0.71% |
0.17% |
| 3 |
3.78% |
4.60% |
2.83% |
1.16% |
0.36% |
0.08% |
| 4 |
1.42% |
1.75% |
1.08% |
0.44% |
0.13% |
0.03% |
| 5 |
0.43% |
0.53% |
0.33% |
0.13% |
0.04% |
0.01% |
For the simulation of the group stage, we picked the most probable scores and in the knockout stage, the team with the highest probability of winning will be progressing to the next round.
The results!
Group stage
The most anticipated part of my post (probably) and here it is! These are the results of the group stages (Apologies for the gridlines):
More detailed head to head results can be found on my Juypter Notebook. Section 3.3 will show the group stage results while the results section at the end shows the entire tournament result.
Knockout stage
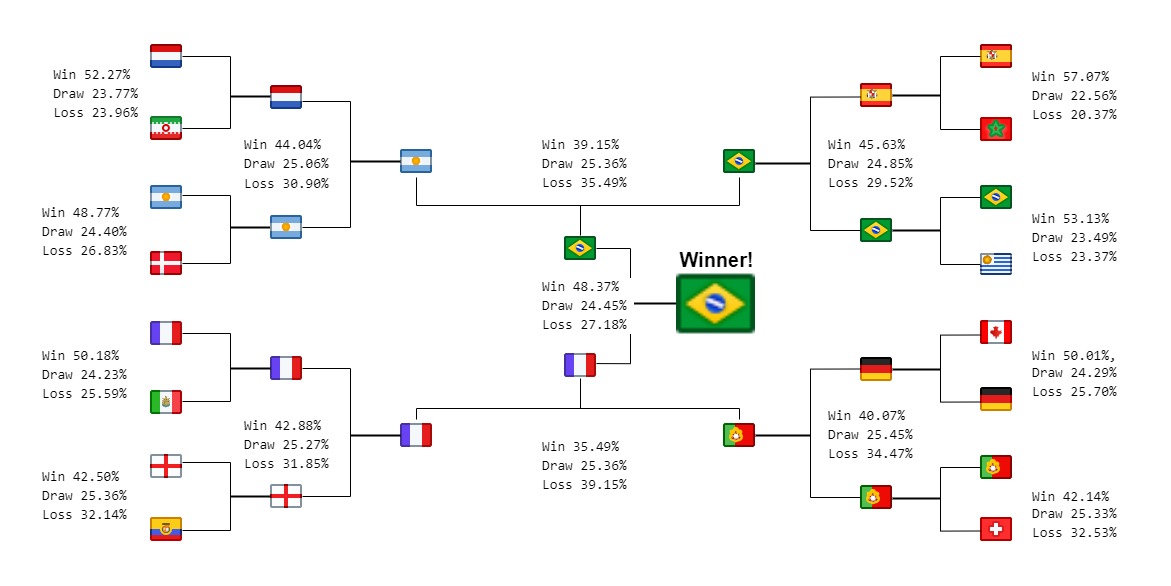
And here are the results from the knockout stage
It looks like Neymar will lead Selecao to the first World Cup in 20 years! It will not be coming home for England as they look to be crashing out against France in the quarter finals. We will not be seeing a hotely anticipated Messi vs Ronaldo final as both will lose their respective games in the Semi Finals.
Observations
Some key observations during the analysis of the results:
-
Common scorelines in the group stage of 1-0 and 1-1. An explanation would be the proximity of probabilities in the 1 goal region. An interesting result is the England group where it appears that nearly all games will end with a 1-1 draw, with England and Iran qualifying to the next round.
-
Low scoring games. This is perhaps reflective of the xG data that we used to train the model. What was observed in our dataset was that international teams do tend to outperform their xG (61% of the matches) in number of goals scored. We should certainly hope that there will be more goals in the tournament!
-
High elo rating = favourites. This is perhaps quite obvious that the higher ranked Elo team tends to have a higher probability of winning (and hence Brazil being the top team emerging as world champions).
Monte Carlo simulation
The above simulation was just based on the outcome where we determined outcome based on the most expected scoreline and outcome of the match. Football is rarely this predictable and there will undoubtedly be surprises along the way.
To address this uncertainty, I ran a Monte Carlo Simulation of the tournament.The objective was to identify who are the clear favourites in the tournament (and perhaps giving a value to the probability of winning the tournament). The set up involves using random poisson generator to determine the goal scored, with the mean being the predicted xG value from the GEE model. This simulation was repeated 1,000 times to determine the most probable winner. In the event of a penalty shootout during the knockout stages, a team will be decided at random due to random nature of penalty shootout outcomes.
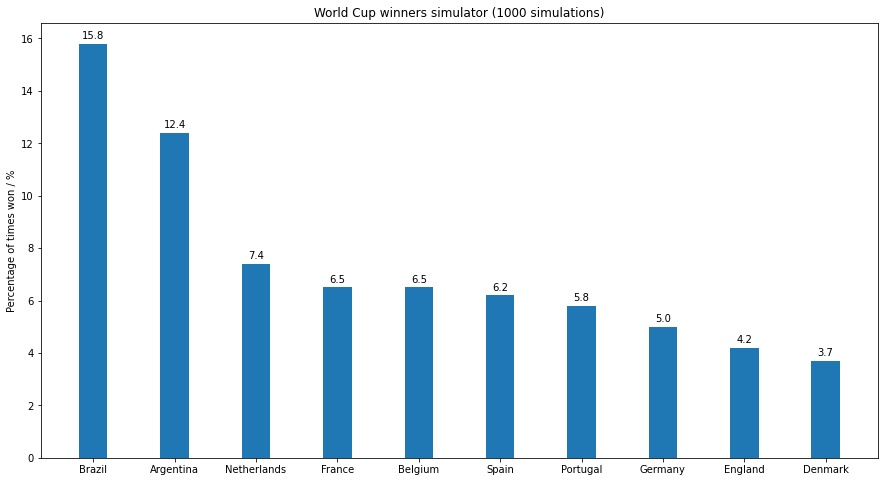
Below are the results showing the top 10 most frequent winners of the tournament.
Unsurprisingly again, Brazil turns up to be the favourites, winning the simulated World Cup tournament an approximately 15.8% of the time. Some interesting observations though - Spain who is ranked third best in the Elo Ratings shows up as 6th favourites to win the tournament. Its suffice to say that the clear favourites are the South American heavy weights Brazil and Argentina.
Conclusion
It definitely took some time to research a novel way get to these results and its due to the inspirational work from Vladimir Dzyuba as well as the Elo Ratings provided by eloratings.net. They have served as the basis and source of truth of most of the assumptions made in the model. Football is never predictable but this hopefully should provide an insightful preview of who are the clear favourites of the tournament.
I will be jetting off to Qatar in about 10 days to catch a couple of games myself and will be back to review how well the model has performed in the group stage. If you enjoyed my work and want to reach out, feel free to contact me! Additionally, if you are feeling generous, feel free to buy us a beer here as I will not be getting much of it in Qatar!
12 Jun 2022
Its been nearly one year and I am making a return. This time not so much about football analytics…
Jubilee weekend 2022 was spent summiting Ben Nevis. I brought along my trusty DJI Mini SE and captured some amazing shots en route to the top. Here’s the video montage of the flight over Fort William and Ben Nevis! Enjoy!

09 Jul 2021
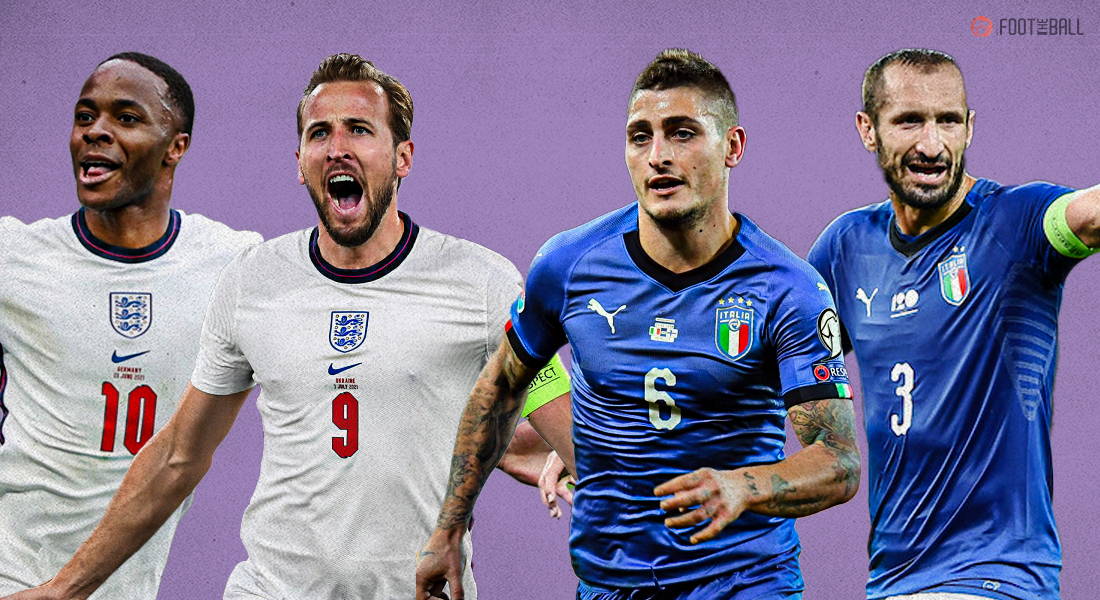
The stage is set in Wembley. Will it come home or will it go to Rome? (Photo credits to foottheball.com)
The time has come for the most anticipated football match of the year - the European championships finals! Many (including myself) expected the powerhouses France, Belgium or Portugal to make it to the final. Instead, it is the dark horses Italy and England, who have both been excellent in the tournament, that will battle it out for the most prestigious European football crown. Will England finally end 30… wait no 55 years of hurt or will the Azzurris add to their repertoire of international trophies?
This will be a fun, semi-serious preview of these 2 impressive teams that have defied expectations to make it this far into the tournament. We look at what made them so successful offensively (22 goals scored) in this tournament and more importantly in title wining sides, defensively (only 4 goals conceded)!
England
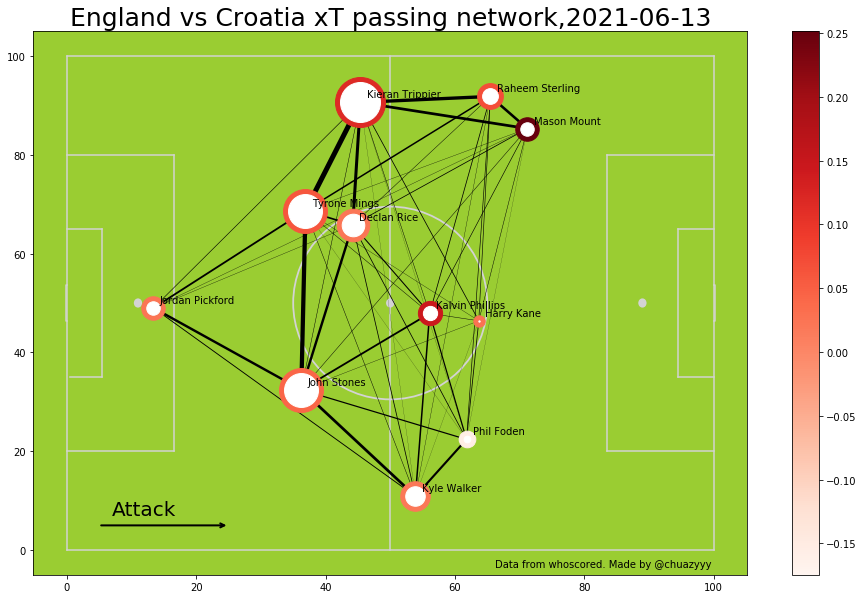
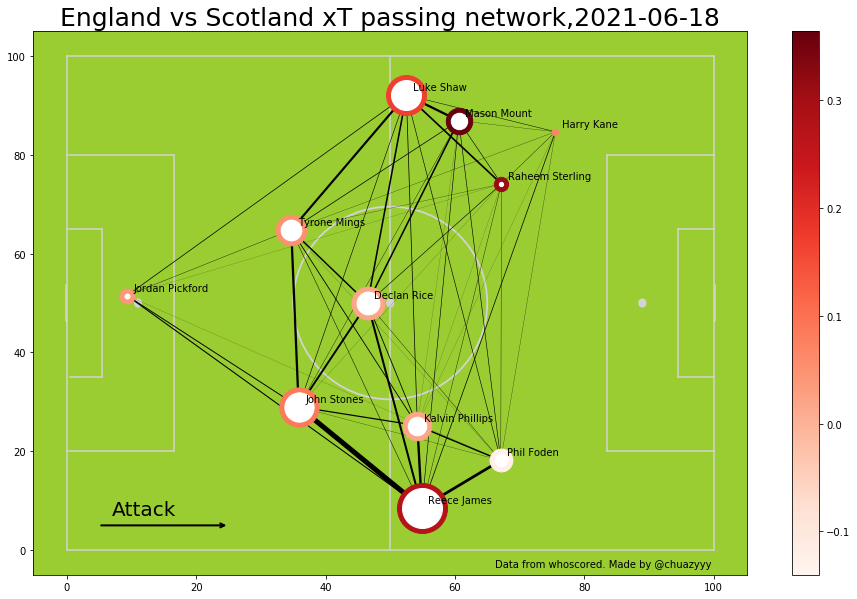
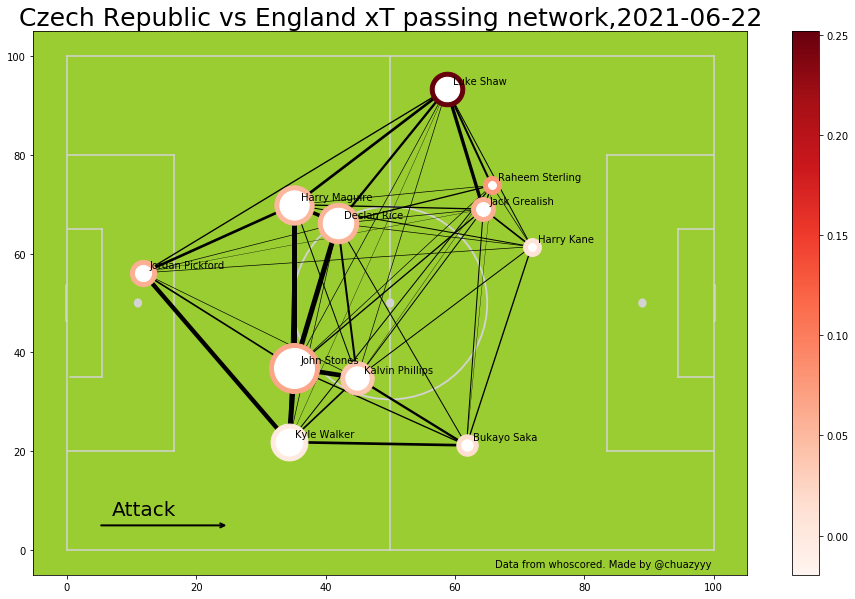
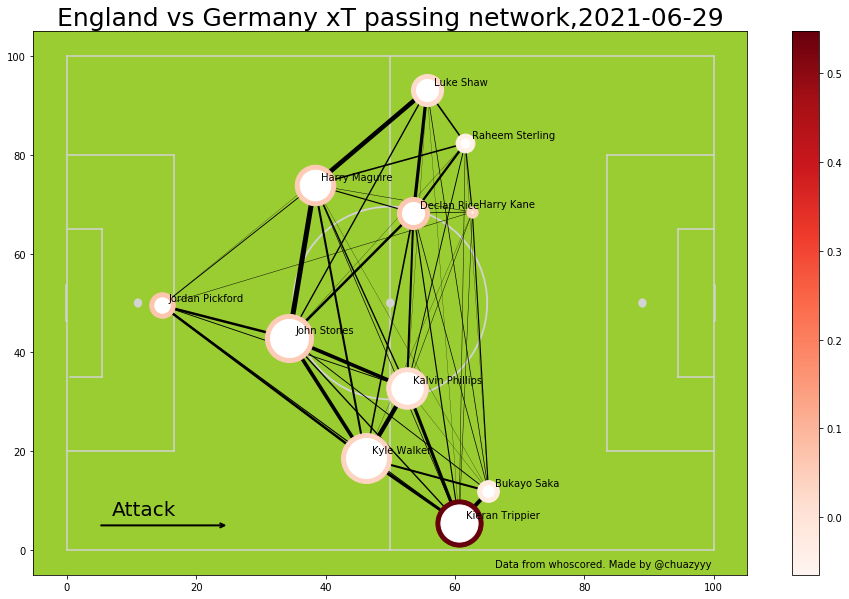
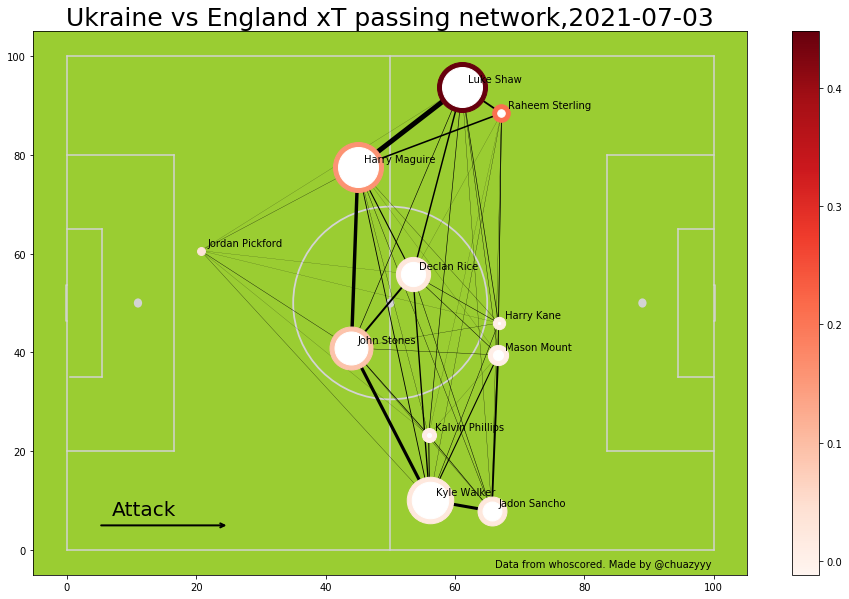
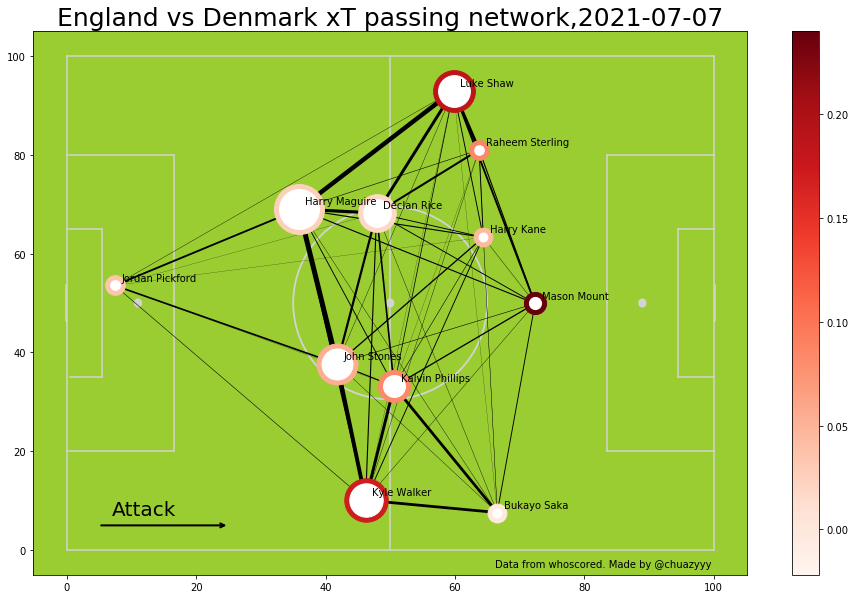
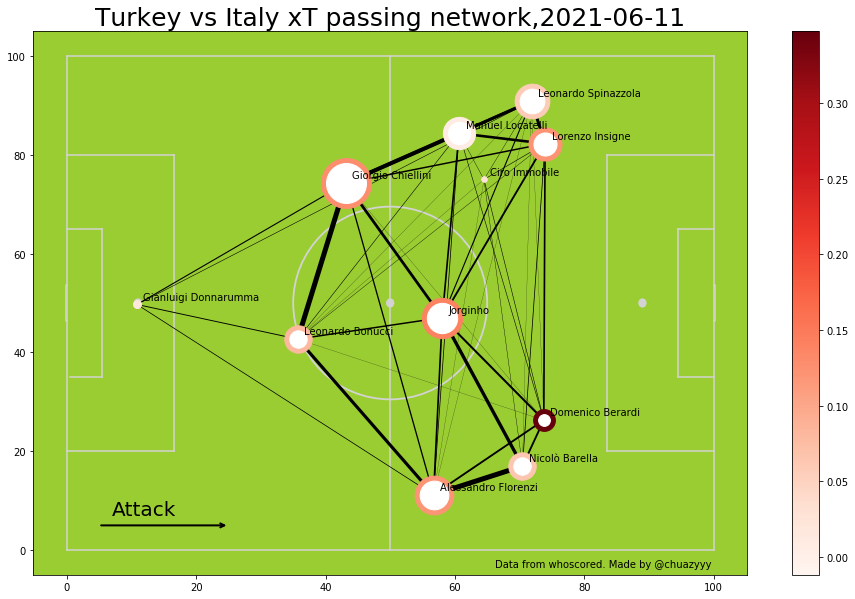
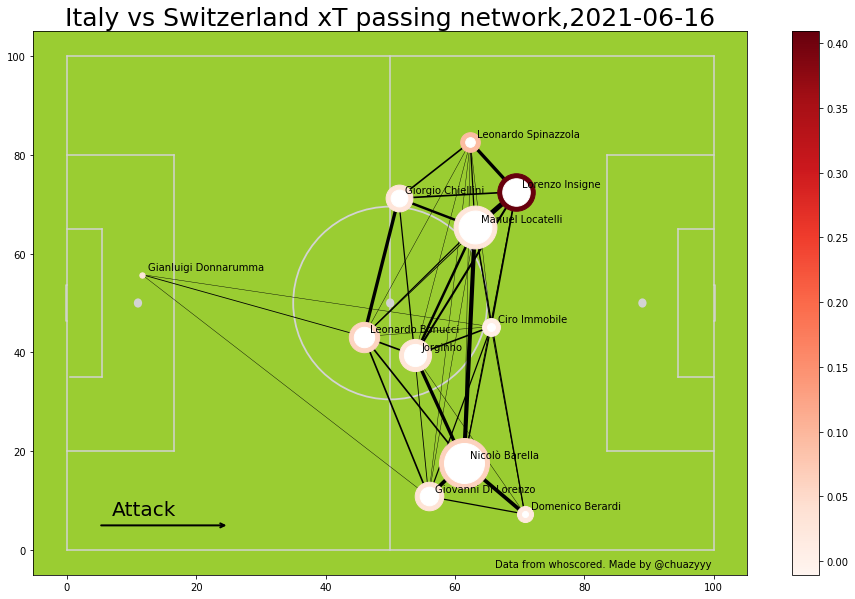
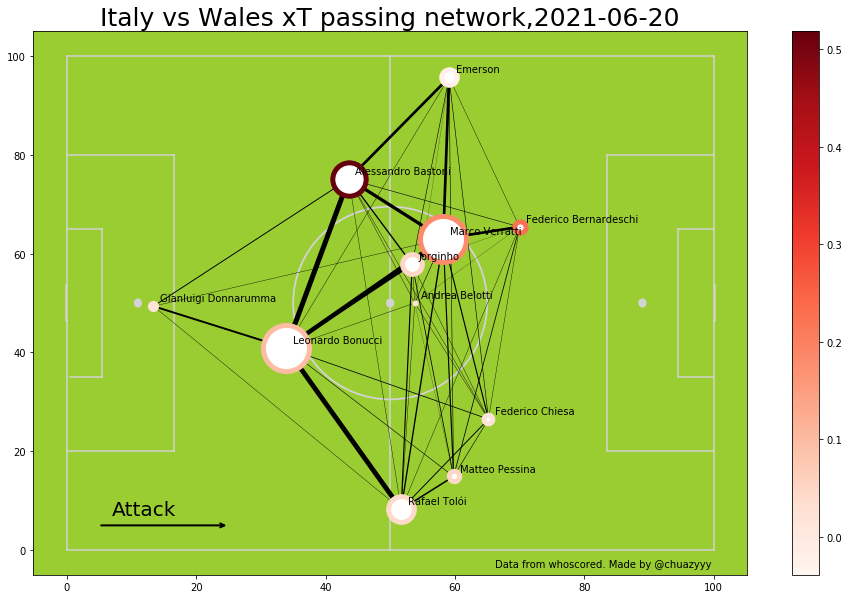
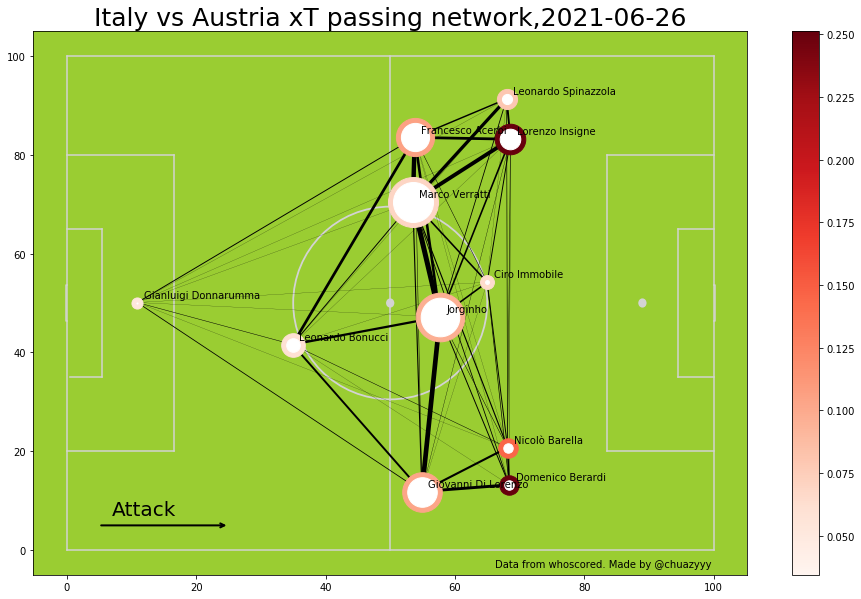
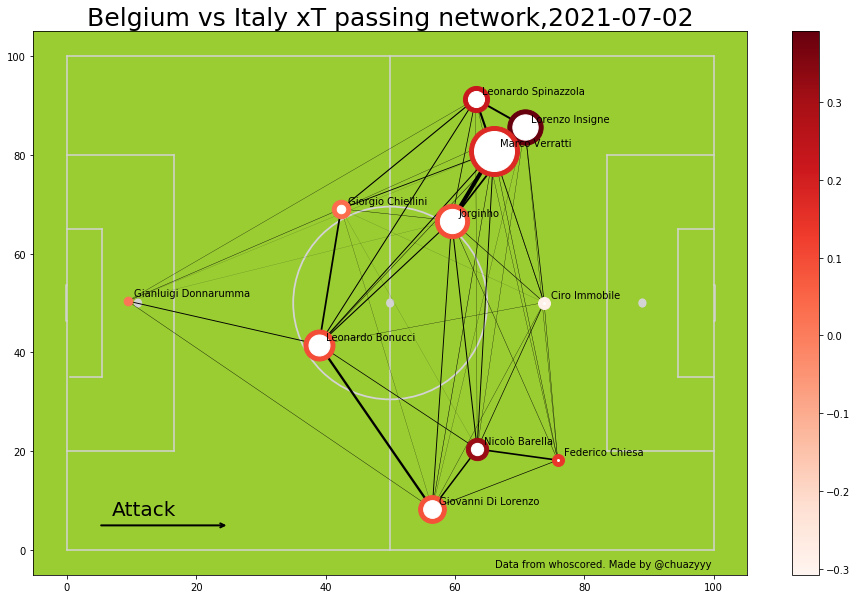
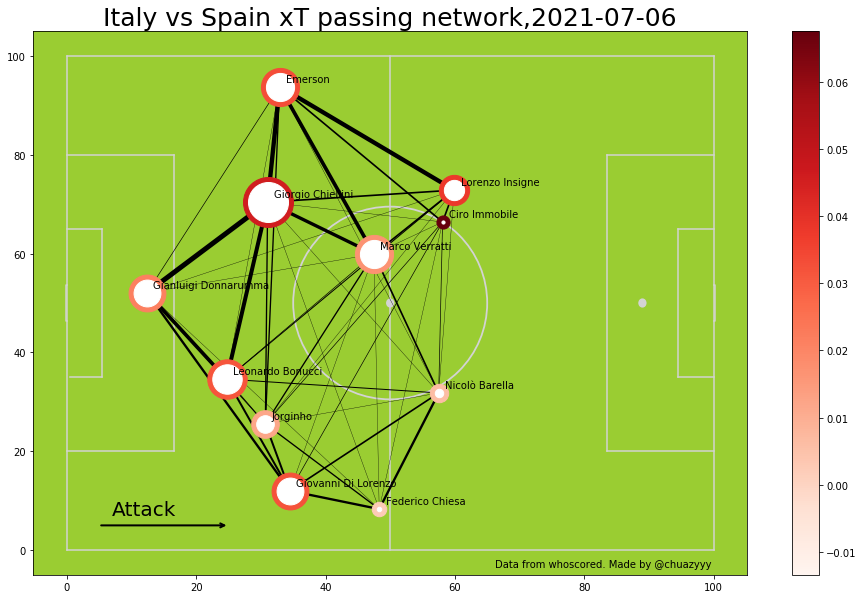
In my previous post, I described the importance of passing networks. In addition, I have layered on expected threat (xT) to emphasise valuable passes that improve the team’s chance of scoring. In summary, the passing networks below will show the important players (represented by the larger nodes), important passing lanes (represented by the thicker edges between 2 nodes) and the total contribution of the player’s passes to the team’s attacking threat of the game (darker nodes). Check out the post here for more details! The graphs below show England’s xT passing network in their 6 Euro 2020 fixtures (Apologies if they are a little small, you can open them up in a new tab to see a clearer image).
In spite of the controversial selection of bringing 10 defenders and only 5 midfielders, Southgate has resisted temptation to play an overly defensive set up. England predominantly employ a 4-2-3-1 formation with the exception of the Germany game where Southgate reverted to a 3 at the back formation (3-4-3).
Rice and Phillips pivot
The double pivot of Declan Rice and Kalvin Phillips has been essential in providing a defensive cover for the back 4. This has led to a run of 5 consecutive games in the European Championship without conceding a goal - a championship record! When we look at the maps, we see how close they are to the back 4. Their instructions are clear - provide a defensive cover for the defenders and transit the ball over to the front 4 or the full backs to provide the attacking threat. Do not expect them to provide too much attacking threat against a similarly solid defensive Italian side.
The full backs
Kyle Walker and more particularly Luke Shaw have been electric. They have been solid defensively and have been a crucial outlet for a lot of England’s attacks. In the games against Ukraine, Germany and the Czech Republic, the full backs have been consistently contributing most to the attacking threat. Luke Shaw has already racked up 3 assists (joint second) despite missing their opening match against Croatia. It is important to also note how large their nodes are - meaning that attacking via the Full Backs instead of through the middle is their gameplan. If England were to win this game, Shaw and Walker will need to be at their absolute best.
Individual talents up front
The Rice and Phillips midfield is definitely one of the core reasons for England’s solid defensive displays. This of course has sacrificed an additional Central Midfielder who can provide a more creative outlet in attack. Personally, I think this works out well for England because of the array of individual attacking talents they have up front. England’s front 4 is usually made up of Mount, Kane, Sterling, Grealish, Saka, Foden and Sancho (the last 4 usually being rotated). Every single one of them has top class technical abilities to dribble, shoot and pass the ball. Based on the maps as well, you can see that their positions can be rather dynamic. Kane (the traditional striker) often sits behind Mount (the traditional attacking midfielder) and their roles can interchange. Both wingers are completely comfortable playing on either wings which is very beneficial for England when they are struggling to find ways past a defence. England are able to rely on individual moments of brilliance to unlock stubborn defences. This also contributes to why England games can be a bore to watch with a lot of sidewards passing. They are constantly experimenting, moving the ball to the wings before someone pops up to provide this long awaited moment of brilliance. With Raheem Sterling being really inspired, Harry Kane finally finding his shooting boots now, the front 4 can be confident of creating many more opportunities in this game
That game against Germany - 3 at the back
I would like to single out the Germany game as it was the only match that Southgate went for a 3 at the back. Traditionally, a 3 at the back formation does add further defensive solidarity to the team whilst sacrificing some offensive threat. Southgate might adopt this formation for the Italian match as he tends to so for tougher opponents.
Italy
The Italians have arguably had to go through a much tougher route to the finals, disposing off Spain and Belgium en route to Wembley. They enjoyed a solid defence record during the group stages, scoring 7 whilst conceding none. Mancini’s men have been disciplined and the Italians look like a really well-oiled machine with everyone on the team knowing exactly what they have to do to scrap through and win matches.
Mancini employs a 4-3-3 system which transits to a 3-4-3 formation when in attack.
Bravo Spinazolla
The back 4 which usually consists of the experienced Chiellini, Bonucci, Spinazzola and deputising right back di Lorenzo will transit to a 3 where Spinazolla will add additional width on the left side. Look at how far up the pitch Spinazolla has been making passes in the Turkey, Switzerland and Austria game - he is nearly on par with the front 3 forwards. Spinazolla has been really impressive, adding an additional dimension to Italy’s attack. With this, the Italians tend to attack down the left flank (42% of their attack coming from the left, 25% through the middle and 33% on the right). Unfortunately, Spinazolla suffered a serious injury in the game against Belgium and had to be replaced by Emerson. It will be a tall order for Emerson to replicate Spinazolla’s feats and Spinazolla’s absence will be sorely felt.
The high backline
The Italians do tend to play with a very high backline baring the Spanish game (compare the average positions of the back 4 for Italy versus that of England). Chiellini and Bonnuci are both very comfortable with the ball at their feet which makes them comfortable playing the ball deeper into midfield. When defending, this falls neatly into their gameplan where they engage a very high press in an attempt to win the ball back immedaiately when they surrender possession to the opposition.
The counter attack and press
Italy have been one of the most exciting teams to watch this tournament and credits should definitely go to Mancini. He has transformed an Italian team which was known for its slow and precise build up from the back play to one of fast counter attacking football. The Italians play a high tempo and quick transition style of football - a hybrid of Tiki-Taka football and direct driving with the ball that many of their players are capable of doing. Midfielders Veratti and Jorginho have been crucial, and they were afforded lots of time to pick up their teammates quickly in the game against Belgium. The English pivot of Rice and Phillips will have to do well to deny any breathing space from the Italian duo.
A wealth of options up front
Very similar to the English, the Italians have such a wide variety of talent up front. Insigne, Chiesa and Immobile are the regular starters but Berardi, Bernardeschi will provide some serious competition to the forwards. Insigne in particular has been pivotal to the success of the Italians. He has consistently been the focal point of their attack (especially on the left when Spinazolla was playing) with an exceptional ability to hit the long shot and dribble in tight spaces. In the maps above you can see that Insigne usually has the biggest and darkest node amongst the front 3 players as he often drops back into midfield to add an extra man and contribute to the build up.
Shots distribution
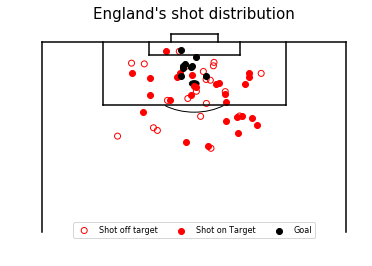
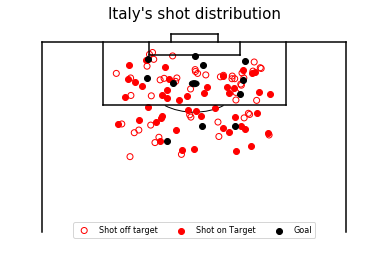
Just another plot for fun but really intesting to see the shots distribution between Italy and England. An obvious observation is that the Italians tend to take more shots from outside the box, and this has already yielded them 3 goals. The English do tend to build patiently around the penalty box and release the trigger when they are in a much better scoring position. The Italians have been on par with the expected goals - scoring 12 goals with a xG of 11.81 while the English have outperformed their xG - scoring 10 with an xG of 8.56.
I strongly suggest checking out Gerald’s plots here as he details out the posession sequences which led to the different shots. Possession sequences consist of passes, dribble/carry and ultimately the shot. They provide insight into how each team attempts to build their attack for example, England will tend to have longer sequences before leading to the shot due to the meticulous style of play, while Italy will have shorter sequences with their rapid, counter attacking style of football.
Our predictions
England vs Italy
Weighted xG (1.60 - 1.81) /
Weighted xGA (0.747 - 1.31)
| |
England goals |
0 |
1 |
2 |
3 |
4 |
5 |
| Italy Goals |
Poisson for # of goals per team |
20.19% |
32.30% |
25.84% |
13.78% |
5.51% |
1.76% |
| 0 |
16.30% |
3.29% |
5.26% |
4.21% |
2.25% |
0.90% |
0.29% |
| 1 |
29.56% |
5.97% |
9.55% |
7.64% |
4.07% |
1.63% |
0.52% |
| 2 |
26.82% |
5.41% |
8.66% |
6.93% |
3.70% |
1.48% |
0.47% |
| 3 |
16.22% |
3.27% |
5.24% |
4.19% |
2.24% |
0.89% |
0.29% |
| 4 |
7.36% |
1.49% |
2.38% |
1.90% |
1.01% |
0.41% |
0.13% |
| 5 |
2.67% |
0.54% |
0.86% |
0.69% |
0.37% |
0.15% |
0.05% |
| Event |
Percentage |
| England Win |
33.73% |
| Draw |
22.46% |
| Italy Win |
42.14% |
| England Win >= 2 Goals |
16.11% |
| Italy Win >= 2 Goals |
22.15% |
| Over 2.5 Goals |
24.17% |
This will be a really difficult match to call with so much as stake. England will feel very encouraged that they have progressed one step further from their Semi-Final exit against Croatia in the World Cup. They will also be buoyed on by the English fans at Wembley. However you cannot write Italy off at all as they have been really impressive. We predict that a draw would be a highest possibility after 90 minutes and after that - well its almost impossible to tell! England 1-1 Italy
Closing words
This has been an absolutely entertaining and joyous tournament especially me being here in London. I have been lucky to catch the England vs Czech Republic game at Wembley and some others whilst pubs have slowly reopened to soak up the electric Euros atmosphere. Writing up our predictions has definitely made watching the games so much more interesting and exciting. I hope you guys have found the predictions really useful (whether it is to place bets or to see if I have beaten Paul) or at least a pleasant read!
01 Jul 2021
The Round of 16 provided the entertainment everyone wanted, with plenty of shocks, valiant comebacks and spectacular goals. We are now nearing the endgame here. The remaining 8 teams will battle it out in the quarters, with every single player knowing that they are just 3 games away from getting their hands on the most coveted trophy in European football. Lets see what the data tells us…
QF1: Spain vs Switzerland (Neutral)
Weighted xG (2.58 - 1.80) /
Weighted xGA (0.97 - 1.77)
| |
Spain goals |
0 |
1 |
2 |
3 |
4 |
5 |
| Switzerland Goals |
Poisson for # of goals per team |
7.56% |
19.52% |
25.20% |
21.70% |
14.01% |
7.24% |
| 0 |
16.52% |
1.25% |
3.22% |
4.16% |
3.58% |
2.31% |
1.20% |
| 1 |
29.74% |
2.25% |
5.81% |
7.50% |
6.45% |
4.17% |
2.15% |
| 2 |
27.01% |
2.02% |
5.23% |
6.75% |
5.81% |
3.75% |
1.94% |
| 3 |
16.07% |
1.21% |
3.14% |
4.05% |
3.49% |
2.25% |
1.16% |
| 4 |
7.24% |
0.55% |
1.41% |
1.82% |
1.57% |
1.01% |
0.52% |
| 5 |
2.61% |
0.20% |
0.51% |
0.66% |
0.57% |
0.37% |
0.19% |
| Event |
Percentage |
| Spain Win |
50.2% |
| Draw |
18.5% |
| Switzerland Win |
25.6% |
| Spain Win >= 2 Goals |
30.9% |
| Switzerland Win >= 2 Goals |
12.1% |
| Over 2.5 Goals |
38.8% |
Based on their recent xG performance, the score matrix put the Spanish as favourites to win with a most probable scoreline of 2-1. In a game featuring 2 teams with high xGs, we can expect goals. The deciding factor could come down to who defends better and the Spanish definitely have a better edge with a lower xGA.
The Swiss have shown great character to reach this far, and Spain definitely have weaknesses which can be exploited. However, Xhaka would be a big miss and Spain will control the midfield better, and the game as well. We fancy a Spanish victory with 2 or more goals (30.9%). Switzerland 1-3 Spain
QF2: Belgium vs Italy (Neutral)
Weighted xG (1.34 - 2.19) /
Weighted xGA (1.66 - 0.78)
| |
Belgium goals |
0 |
1 |
2 |
3 |
4 |
5 |
| Italy Goals |
Poisson for # of goals per team |
26.15% |
35.08% |
23.52% |
10.52% |
3.53% |
0.95% |
| 0 |
11.21% |
2.93% |
3.93% |
2.64% |
1.18% |
0.40% |
0.11% |
| 1 |
24.53% |
6.41% |
8.60% |
5.77% |
2.58% |
0.87% |
0.23% |
| 2 |
26.84% |
7.02% |
9.41% |
6.31% |
2.82% |
0.95% |
0.25% |
| 3 |
19.58% |
5.12% |
6.87% |
4.61% |
2.06% |
0.69% |
0.19% |
| 4 |
10.71% |
2.80% |
3.76% |
2.52% |
1.13% |
0.38% |
0.10% |
| 5 |
4.69% |
1.23% |
1.65% |
1.10% |
0.49% |
0.17% |
0.04% |
| Event |
Percentage |
| Belgium Win |
22.7% |
| Draw |
20.3% |
| Italy Win |
54.3% |
| Belgium Win >= 2 Goals |
9.4% |
| Italy Win >= 2 Goals |
32.6% |
| Over 2.5 Goals |
25.3% |
The Belgiums did struggle to create many chances against the Portuguese but they did score that all important goal to get them through to the QFs. The Italians on the other hand have been free scoring (9 goals) and are favourites to win this game according to the score matrix. The most probable score is 2-1 to Italy.
A matured golden generation against possibly a maturing one, Belgium have shown real pragmatism this tournament. The injuries have hit them hard, and Italy were put to the test against Austria more than expected. This game may go the distance, but we expect the Italians’ lack of tournament experience in recent years to cost them. This might be a close affair but we do see the Belgiums nicking it. Belgium 1-1 Italy (Belgium to win 2-1 in extra time)
QF3: Czech Republic vs Denmark (Neutral)
Weighted xG (1.26 - 2.20) /
Weighted xGA (1.05 - 1.01)
| |
Czech Republic goals |
0 |
1 |
2 |
3 |
4 |
5 |
| Denmark Goals |
Poisson for # of goals per team |
28.44% |
35.76% |
22.48% |
9.42% |
2.96% |
0.74% |
| 0 |
11.01% |
3.13% |
3.94% |
2.47% |
1.04% |
0.33% |
0.08% |
| 1 |
24.29% |
6.91% |
8.69% |
5.46% |
2.29% |
0.72% |
0.18% |
| 2 |
26.80% |
7.62% |
9.58% |
6.02% |
2.52% |
0.79% |
0.20% |
| 3 |
19.71% |
5.61% |
7.05% |
4.43% |
1.86% |
0.58% |
0.15% |
| 4 |
10.87% |
3.09% |
3.89% |
2.44% |
1.02% |
0.32% |
0.08% |
| 5 |
4.80% |
1.36% |
1.72% |
1.08% |
0.45% |
0.14% |
0.04% |
| Event |
Percentage |
| Czech Republic Win |
20.8% |
| Draw |
20.1% |
| Denmark Win |
56.4% |
| Czech Republic Win >= 2 Goals |
8.25% |
| Denmark Win >= 2 Goals |
34.3% |
| Over 2.5 Goals |
24.0% |
The Danes are favourites to win this tie with a most probable score of 2-1. Their really impressive performance against the Welsh did their xG many favours. The Czechs too were excellent against the Netherlands, scoring 2 while generating an xG of 1.56. These 2 in-form teams would be hard to separate.
The Danes fairytale story continues and they showed great quality against the Welsh last time out. The Czechs have done well to come this far, but do not inspire us as a team who have the consistency to grind out tournament victories. A solid Danish performance would secure them a win in this fixture. In this case, we will agree with the score matrix and go with the most probable score. Czech Republic 1-2 Denmark
QF4: Ukraine vs England (Neutral)
Weighted xG (1.37 - 1.10) /
Weighted xGA (1.66 - 0.91)
| |
Ukraine goals |
0 |
1 |
2 |
3 |
4 |
5 |
| England Goals |
Poisson for # of goals per team |
25.39% |
34.81% |
23.85% |
10.90% |
3.73% |
1.02% |
| 0 |
33.20% |
8.43% |
11.56% |
7.92% |
3.62% |
1.24% |
0.34% |
| 1 |
36.61% |
9.30% |
12.74% |
8.73% |
3.99% |
1.37% |
0.37% |
| 2 |
20.18% |
5.13% |
7.02% |
4.81% |
2.20% |
0.75% |
0.21% |
| 3 |
7.42% |
1.88% |
2.58% |
1.77% |
0.81% |
0.28% |
0.08% |
| 4 |
2.04% |
0.52% |
0.71% |
0.49% |
0.22% |
0.08% |
0.02% |
| 5 |
0.45% |
0.11% |
0.16% |
0.11% |
0.05% |
0.02% |
0.00% |
| Event |
Percentage |
| Ukraine Win |
42.9% |
| Draw |
26.9% |
| England Win |
30.1% |
| Ukraine Win >= 2 Goals |
19.9% |
| England Win >= 2 Goals |
11.7% |
| Over 2.5 Goals |
10.1% |
A very controversial score matrix puts Ukraine as favourites! This is due to the English inability to create goalscoring opportunities, with them only able to generate an average xG of 1.11 per game in the tournament so far. However, it is important to note that Ukraine’s xG has been generated against weaker opposition, with their most recent game against 10 men Sweden helping to boost their form weighted xG.
The English have done well so far, to grind out the necessary results. Without home advantage, they may face more issues, but we fancy their solid midfield to ensure their clean sheet record is intact, and to tuck away enough chances to win. We shall not be be as bold as the matrix and predict an English victory. Ukraine 0-2 England
25 Jun 2021

Knockout football promises to be the most gripping, exciting stages of the tournament. Expect drama, jubilation and tears as we enter the heartbreaking part of the tournament where there can only be winners or losers. (Photo credits to The Ringer)
Our Round of 16 predictions will follow the same methodology we adopted in the last round of fixtures of the group stages.
RO16 Match 1: Wales vs Denmark
Weighted xG (1.13 - 2.09) /
Weighted xGA (2.12 - 0.95)
| |
Wales goals |
0 |
1 |
2 |
3 |
4 |
5 |
| Denmark Goals |
Poisson for # of goals per team |
32.30% |
26.50% |
20.62% |
7.77% |
2.19% |
0.50% |
| 0 |
12.32% |
3.98% |
4.50% |
2.54% |
0.96% |
0.27% |
0.06% |
| 1 |
25.80% |
8.33% |
9.42% |
5.32% |
2.00% |
0.57% |
0.13% |
| 2 |
27.01% |
8.72% |
9.86% |
5.57% |
2.10% |
0.59% |
0.13% |
| 3 |
18.85% |
6.09% |
6.88% |
3.89% |
1.46% |
0.41% |
0.09% |
| 4 |
9.87% |
3.19% |
3.60% |
2.04% |
0.77% |
0.22% |
0.05% |
| 5 |
4.13% |
1.34% |
1.51% |
0.85% |
0.32% |
0.09% |
0.02% |
| Event |
Percentage |
| Wales Win |
19.7% |
| Draw |
20.7% |
| Denmark Win |
57.5% |
| Wales Win >= 2 Goals |
7.35% |
| Denmark Win >= 2 Goals |
34.54% |
| Over 2.5 Goals |
20.24% |
The data shows that Denmark are clearly the favourites with a win probability of 57.5% and a most probable score of 2-1 to the Danes. This is similar to Gerald’s prediction of a Danish win at 65% and a most probable score of 2-0.
Wales have proven to be a tough outfit to break down, and will pose a stern challenge for a Danish team who did well to make it out of the groups given the situation. I’m gonna sit on the fence for the 90 mins, but tip a 2-1 Danish win after extra time. Wales 1-2 Denmark
RO16 Game 2: Italy vs Austria (Neutral ground)
Weighted xG (2.26 - 1.37) /
Weighted xGA (0.62 - 1.02)
| |
Italy goals |
0 |
1 |
2 |
3 |
4 |
5 |
| Austria Goals |
Poisson for # of goals per team |
10.40% |
23.54% |
26.64% |
20.10% |
11.37% |
5.15% |
| 0 |
25.48% |
2.65% |
6.00% |
6.79% |
5.12% |
2.90% |
1.31% |
| 1 |
34.84% |
3.62% |
8.20% |
9.28% |
7.00% |
3.96% |
1.79% |
| 2 |
23.82% |
2.48% |
5.61% |
6.34% |
4.79% |
2.71% |
1.23% |
| 3 |
10.86% |
1.13% |
2.56% |
2.89% |
2.18% |
1.23% |
0.56% |
| 4 |
3.71% |
0.39% |
0.87% |
0.99% |
0.75% |
0.42% |
0.19% |
| 5 |
1.01% |
0.11% |
0.24% |
0.27% |
0.20% |
0.12% |
0.05% |
| Event |
Percentage |
| Italy Win |
54.86% |
| Draw |
19.85% |
| Austria Win |
22.21% |
| Italy Win >= 2 Goals |
33.37% |
| Austria Win >= 2 Goals |
9.23% |
| Over 2.5 Goals |
26.86% |
Italy are favourites in this matchup with a 55% percentage of winning. Gerald’s model predicts a most probable scoreline of 1-0 and an 66% probability of an Italian win.
Italy are yet to concede a goal and we fancy them shutting Austria out as well. Italy will control the game and dispatch enough chances to get a comfortable win. Italy 2-0 Austria
RO16 Match 3: Netherlands vs Czech Republic (Neutral)
Weighted xG (2.04 - 1.16) /
Weighted xGA (1.05 - 1.17)
| |
Netherlands goals |
0 |
1 |
2 |
3 |
4 |
5 |
| Czech Republic Goals |
Poisson for # of goals per team |
12.99% |
26.51% |
27.06% |
18.41% |
9.40% |
3.84% |
| 0 |
31.22% |
4.05% |
8.28% |
8.45% |
5.75% |
2.93% |
1.20% |
| 1 |
36.34% |
4.72% |
9.63% |
9.83% |
6.69% |
3.41% |
1.39% |
| 2 |
21.15% |
2.75% |
5.61% |
5.72% |
3.89% |
1.99% |
0.81% |
| 3 |
8.21% |
1.07% |
2.18% |
2.22% |
1.51% |
0.77% |
0.31% |
| 4 |
3.88% |
1.53% |
1.42% |
0.66% |
0.20% |
0.05% |
0.01% |
| 5 |
0.56% |
0.07% |
0.15% |
0.15% |
0.10% |
0.05% |
0.02% |
| Event |
Percentage |
| Netherlands Win |
55.81% |
| Draw |
21.17% |
| Czech Republic Win |
21.09% |
| Finland Win >= 2 Goals |
32.94% |
| Belgium Win >= 2 Goals |
8.05% |
| Over 2.5 Goals |
20.10% |
Netherlands are favourites according to the score matrix due the high xG they have recorded in their group stages. The Czechs have scored much lower xG although they have faced much tougher oppositions in Croatia, Scotland and England. Gerald’s model puts Netherlands as 1-0 victors and at 58% win probability which again is very similar to the one we have used here.
The Czech’s games have been really tight, whilst the Dutch have not played the highest quality of oppositions. The Dutch attack looks formidable and we expect them to create enough chances and come away with a win. Netherlands 2-0 Czech Republic
RO16 Game 4: Belgium vs Portugal (Neutral Ground)
Weighted xG (1.65 - 2.00) /
Weighted xGA (1.20 - 1.35)
| |
Belgium goals |
0 |
1 |
2 |
3 |
4 |
5 |
| Portugal Goals |
Poisson for # of goals per team |
19.18% |
31.67% |
26.15% |
14.39% |
5.94% |
1.96% |
| 0 |
13.60% |
2.61% |
4.31% |
3.56% |
1.96% |
0.81% |
0.27% |
| 1 |
27.13% |
5.20% |
8.59% |
7.09% |
3.91% |
1.61% |
0.53% |
| 2 |
27.07% |
5.19% |
8.57% |
7.08% |
3.90% |
1.61% |
0.53% |
| 3 |
18.00% |
3.45% |
5.70% |
4.71% |
2.59% |
1.07% |
0.35% |
| 4 |
8.98% |
1.72% |
2.84% |
2.35% |
1.29% |
0.53% |
0.18% |
| 5 |
3.58% |
0.69% |
1.14% |
0.94% |
0.52% |
0.21% |
0.07% |
| Event |
Percentage |
| Belgium Win |
31.67% |
| Draw |
21.47% |
| Portugal Win |
44.53% |
| Belgium Win >= 2 Goals |
15.13% |
| Portugal Win >= 2 Goals |
24.54% |
| Over 2.5 Goals |
27.92% |
This will be a tough game to call. The model puts 1-1 as the most probable result, with Portugal favourites to win the game at 44.53%. Conversely, Gerald’s model puts Belgium as favourites to win at a 40% probability. Belgium have been impeccable in their group stages while Portugal emerged from the Group of Death in 3rd.
Fernando Santos’ team relies on defensive solidarity and hitting teams on the counter, which means they should have decent amount of chances against Roberto Martinez’s side. But such an approach would also invite pressure and the Belgians have enough talent and creativity to put a few goals past the Portuguese. In this case, we will go for a Belgium win due to many key players missing out for Portugal. Belgium 2-1 Portugal
RO16 Match 5: Croatia vs Spain (Neutral)
Weighted xG (1.46 - 2.74) /
Weighted xGA (1.10 - 0.81)
| |
Croatia goals |
0 |
1 |
2 |
3 |
4 |
5 |
| Spain Goals |
Poisson for # of goals per team |
23.33% |
33.96% |
24.71% |
11.99% |
4.36% |
1.27% |
| 0 |
6.47% |
1.51% |
2.20% |
1.60% |
0.78% |
0.28% |
0.08% |
| 1 |
17.71% |
4.13% |
6.01% |
4.38% |
2.12% |
0.77% |
0.22% |
| 2 |
24.25% |
5.66% |
8.23% |
5.99% |
2.91% |
1.06% |
0.31% |
| 3 |
22.13% |
5.16% |
7.52% |
5.47% |
2.65% |
0.97% |
0.28% |
| 4 |
15.16% |
3.54% |
5.15% |
3.74% |
1.82% |
0.66% |
0.19% |
| 5 |
8.30% |
1.94% |
2.82% |
2.05% |
0.99% |
0.36% |
0.11% |
| Event |
Percentage |
| Croatia Win |
18.14% |
| Draw |
16.93% |
| Spain Win |
58.58% |
| Croatia Win >= 2 Goals |
7.5% |
| Spain Win >= 2 Goals |
38.57% |
| Over 2.5 Goals |
34.55% |
Spain are favourites in this clash thanks to their 5-0 demolition of Slovakia substantially boosting their xG. The most probable score is a 2-1 win for Spain. Gerald’s model puts Spain as 2-0 winners and a whopping 70% chance of winning.
The Croats have only really come to life in their last game, as did Spain. Spain were excellent against Slovakia and dispatched their chances but it was mainly due to the horrendous defending from the Slovaks. They will not create as many chances against opposition with a good control of midfield. This game may go the distance (potentially extra time) but we are tipping Spain to edge this cagey affair. Croatia 1-2 Spain
RO16 Match 6: France vs Switzerland (Neutral Ground)
Weighted xG (1.58 - 2.00) /
Weighted xGA (1.05 - 1.46)
| |
France goals |
0 |
1 |
2 |
3 |
4 |
5 |
| Switzerland Goals |
Poisson for # of goals per team |
20.65% |
32.58% |
25.69% |
13.51% |
5.33% |
1.68% |
| 0 |
13.48% |
2.78% |
4.39% |
3.46% |
1.82% |
0.72% |
0.23% |
| 1 |
27.01% |
5.58% |
8.80% |
6.94% |
3.65% |
1.44% |
0.45% |
| 2 |
27.07% |
5.59% |
8.82% |
6.95% |
3.66% |
1.44% |
0.45% |
| 3 |
18.08% |
3.73% |
5.89% |
4.65% |
2.44% |
0.96% |
0.30% |
| 4 |
9.06% |
1.87% |
2.95% |
2.33% |
1.22% |
0.48% |
0.15% |
| 5 |
3.63% |
0.75% |
1.18% |
0.93% |
0.49% |
0.19% |
0.06% |
| Event |
Percentage |
| France Win |
30.07% |
| Draw |
21.52% |
| Switzerland Win |
46.18% |
| France Win >= 2 Goals |
13.97% |
| Switzerland Win >= 2 Goals |
25.72% |
| Over 2.5 Goals |
26.77% |
Another strange one where the score matrix puts the Swiss as favourites against the world champions, and a most probable score of 2-1. Gerald’s model puts the French as favourites at 44%, althogh the most probable score will be a 1-1 draw. This is mainly due to the French struggling to create high quality chances in their group stages. Having only scored 4 (1 own goal and 1 penalty), they have been outperformed by the Swiss in their xG performance.
The French have struggled for goals in the groups despite creating decent chances, but were unlucky to be placed in such a tough group and still came out on top. We fancy things to click for them in the knockouts and emerge with a comfortable victory. France 2-0 Switzerland
RO16 Match 7: England vs Germany (Home Advantage)
Weighted xG (1.16 - 2.03) /
Weighted xGA (0.88 - 1.01)
| |
England goals |
0 |
1 |
2 |
3 |
4 |
5 |
| Germany Goals |
Poisson for # of goals per team |
31.31% |
36.36% |
21.11% |
8.17% |
2.37% |
0.55% |
| 0 |
13.12% |
4.11% |
4.77% |
2.77% |
1.07% |
0.31% |
0.07% |
| 1 |
26.64% |
8.34% |
9.69% |
5.62% |
2.18% |
0.63% |
0.15% |
| 2 |
27.06% |
8.47% |
9.84% |
5.71% |
2.21% |
0.64% |
0.15% |
| 3 |
18.32% |
5.74% |
6.66% |
3.87% |
1.50% |
0.43% |
0.10% |
| 4 |
9.31% |
2.91% |
3.38% |
1.96% |
0.76% |
0.22% |
0.05% |
| 5 |
3.78% |
1.18% |
1.37% |
0.80% |
0.31% |
0.09% |
0.02% |
| Event |
Percentage |
| England Win |
21.16% |
| Draw |
21.25% |
| Germany Win |
55.69% |
| England Win >= 2 Goals |
8.07% |
| Germany Win >= 2 Goals |
32.80% |
| Over 2.5 Goals |
19.91% |
The score matrix puts Germany as favourites with the most probable score being a 1-1 draw. Gerald’s model says that England will win with a 46% probability and a most probable score of 1-0 to England. Similar to France, England have struggled to create anything moving forward having only scored 2 goals in the tournament.
England have been lacking creativity and cohesiveness in attack, but surely there’s no way Kane would be dropped. It’s a struggle to get him in the game, and we think the Germans’ defence may not be troubled enough in this game. We are backing the Germans to dump the English out once more. England 0-2 Germany
RO16 Match 8 : Sweden vs Ukraine (Neutral Ground)
Weighted xG (1.42 - 1.34) /
Weighted xGA (1.82 - 1.64)
| |
Sweden goals |
0 |
1 |
2 |
3 |
4 |
5 |
| Ukraine Goals |
Poisson for # of goals per team |
24.09% |
34.29% |
24.40% |
11.58% |
4.12% |
1.17% |
| 0 |
26.17% |
6.30% |
8.97% |
6.39% |
3.03% |
1.08% |
0.31% |
| 1 |
35.08% |
8.45% |
12.03% |
8.56% |
4.06% |
1.45% |
0.41% |
| 2 |
23.52% |
5.67% |
8.06% |
5.74% |
2.72% |
0.97% |
0.28% |
| 3 |
10.51% |
2.53% |
3.60% |
2.56% |
1.22% |
0.43% |
0.12% |
| 4 |
3.52% |
0.85% |
1.21% |
0.86% |
0.41% |
0.15% |
0.04% |
| 5 |
0.94% |
0.23% |
0.32% |
0.23% |
0.11% |
0.04% |
0.01% |
| Event |
Percentage |
| Sweden Win |
38.82% |
| Draw |
25.44% |
| Ukraine Win |
35.13% |
| Sweden Win >= 2 Goals |
18.09% |
| Ukraine Win >= 2 Goals |
15.61% |
| Over 2.5 Goals |
14.07% |
Score matrix puts the most probable score at 1-1, with quite an even game between Sweden and Ukraine. The Swedes are edging it in terms of probability of winning at 38%. Gerald’s model is similar with a most probable score at 1-1 and Swedes winning with at 42.5% probability.
The Swedes have shown fantastic game management this tournament, whilst Ukraine have disappointed us slightly in terms of results when their squad should have more to show for. This will be a closely competitive match between teams that do not create too many opportunities and we expect this to be decided by a penalty shootout. Sweden 1-1 Ukraine (Sweden to win on penalties)

