19 Jun 2021
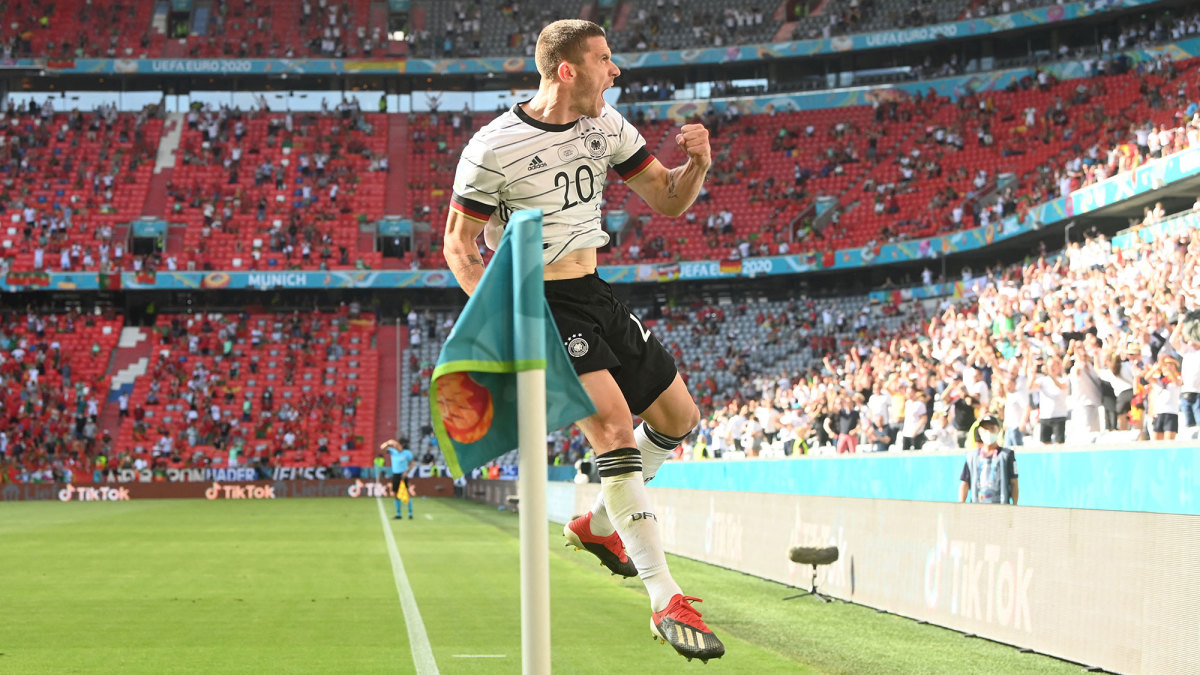
The Germans were back to their best with an impressive performance against the Portugese with a man of the match performance from Robin Gosens. They may top the group with a convincing performance against Hungary.
Following a not so successful 2nd round (5/12 outcomes predicted correctly and only 1 exact scoreline), we will be adopting a newer approach to our predictions. We all knew that exact score predictions were going to be very difficult so we are adopting a probability based approach to determine the most likely outcome of the match. Layering this with some of our opinion of the games, we will derive a final predicted result.
Combining methods - Poisson and weighted xG
Due to the randomness of the beautiful game, it is already a tall order to predict the exact score of the game. A goal in a match does not depend on previous goals or any other factors. With this, we turn to statistics in an attempt to predict the most probable outcome of the game. Fortunately, there is a distribution that follows the nature of this random occuring events and that is the Poisson distribution. In the graph below created by David Sheehan, we can clearly see that the goals per game follows a Poisson distribution.
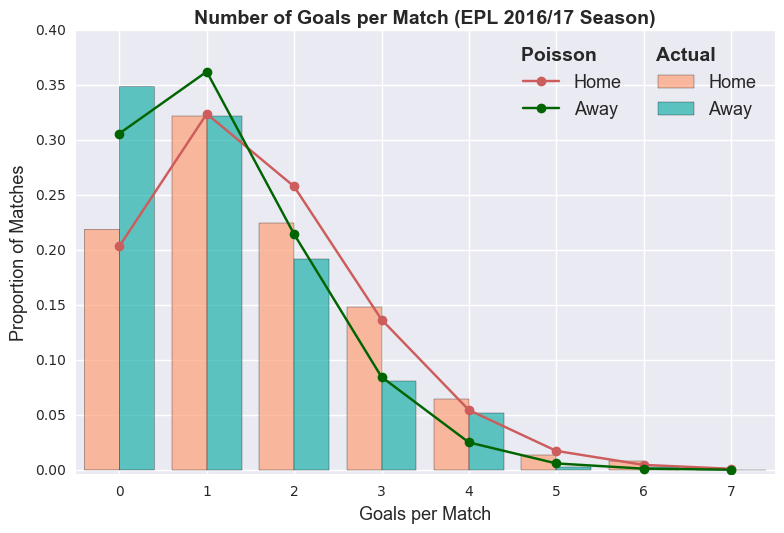
The actual goals scored by English Premier League teams (Home and Away) versus the Poisson distribution of goals scored. All credits of this image goes to David Sheehan.
With this, we are able to convert a single average value into a probability for changeable outcomes. We employed our weighted Expected Goals (xG) as the single average value used in the Poisson Distribution per team and calculated the distribution of goals scored in a game for each respective team. Following which, a score matrix emerges which tells us the probability of goals scored for each respective team. The probabilities are multiplied with each other to create the score matrix and we will be able to identify the “most probable” outcome. However, we should not be distracted by the most probable score because most of the probabilities are really close to each other. What would give us more confidence in are the specific outcomes - Win/Draw/Lose, Team A/B winning by more than 2 goals or if a game is likely to be high scoring. For more details, please check out this post from Smarkets!
As always, there is a huge caveat when predicting scores like this as it is very dependent on the average value we put into the distribution for each team. The weighted xG is very much a form dependent metric and a team may completely over or underperform their xG values. We also recognised that Home ground advantage plays a very important role in this tournament. Of the 8 games which were played by a team in their Home stadium, there were 4 victories, 3 draws (including the impressive 1-1 draw between Hungary and France) and only 1 loss (Denmark lost 2-1 to Belgium). The weighted xG does not take this into account due to a lack of Home and Away matches data but we will factor this into our final predictions.
Group A: Italy vs Wales (Home Advantage)
Weighted xG (2.10 - 1.42) /
Weighted xGA (0.611 - 1.86)
| |
Italy goals |
0 |
1 |
2 |
3 |
4 |
5 |
| Wales Goals |
Poisson for # of goals per team |
12.28% |
25.75% |
27.01% |
18.88% |
9.90% |
4.15% |
| 0 |
24.28% |
2.98% |
6.25% |
6.56% |
4.58% |
2.40% |
1.01% |
| 1 |
34.37% |
4.22% |
8.85% |
9.28% |
6.49% |
3.40% |
1.43% |
| 2 |
24.32% |
2.99% |
6.26% |
6.57% |
4.59% |
2.41% |
1.01% |
| 3 |
11.48% |
1.41% |
2.96% |
3.10% |
2.17% |
1.14% |
0.48% |
| 4 |
4.06% |
0.50% |
1.05% |
1.10% |
0.77% |
0.40% |
0.17% |
| 5 |
1.15% |
0.14% |
0.30% |
0.31% |
0.22% |
0.11% |
0.05% |
| Event |
Percentage |
| Italy Win |
51.2% |
| Draw |
21.02% |
| Wales Win |
25.42% |
| Italy Win >= 2 Goals |
29.77% |
| Wales Win >= 2 Goals |
10.96% |
| Over 2.5 Goals |
25.33% |
The data shows that Italy are clearly the favourites with a win probability of 51.2%. With the Italians cheering them on in Rome, it may look like this is a certain Italian victory.
Italy have been the standouts of the tournament so far, whilst Wales have been more resilient than we expected. Wales know they have to keep the scoreline down to boost their chances of going through, and we expect a really defensive performance but Italy still proving too much to handle. Wales would lose the midfield battle, but may throw bodies behind the ball in defensive positions to get as many blocks as possible. Italy 2-0 Wales
Group A: Switzerland vs Turkey (Neutral)
Weighted xG (1.79 - 1.29) /
Weighted xGA (1.16 - 1.85)
| |
Switzerland goals |
0 |
1 |
2 |
3 |
4 |
5 |
| Turkey Goals |
Poisson for # of goals per team |
17.07% |
30.18% |
26.67% |
15.72% |
6.95% |
2.46% |
| 0 |
27.42% |
4.68% |
8.27% |
7.31% |
4.31% |
1.91% |
0.67% |
| 1 |
35.48% |
6.06% |
10.71% |
9.46% |
5.58% |
2.47% |
0.87% |
| 2 |
22.95% |
3.92% |
6.93% |
6.12% |
3.61% |
1.59% |
0.56% |
| 3 |
9.90% |
1.69% |
2.99% |
2.64% |
1.56% |
0.69% |
0.24% |
| 4 |
3.20% |
0.55% |
0.97% |
0.85% |
0.50% |
0.22% |
0.08% |
| 5 |
0.83% |
0.14% |
0.25% |
0.22% |
0.13% |
0.06% |
0.02% |
| Event |
Percentage |
| Switzerland Win |
47.63% |
| Draw |
23.31% |
| Turkey Win |
27.89% |
| Switzerland Win >= 2 Goals |
25.52% |
| Turkey Win >= 2 Goals |
11.71% |
| Over 2.5 Goals |
18.35% |
The most probable score might be a 1-1 draw but it is most probable for the Swiss to snatch their first 3 points of the campaign.
Turkey were fancied as dark horses but have been extremely underwhelming so far. The Swiss are too having difficulty creating chances, with the Italian defence completely nullifying their threat in the previous matchday. We expect another disappointing performance from the Turks as Switzerland edge out a tense game. Switzerland 1-0 Turkey
Group B: Finland vs Belgium (Neutral)
Weighted xG (0.93 - 1.39) /
Weighted xGA (1.79 - 1.31)
| |
Finland goals |
0 |
1 |
2 |
3 |
4 |
5 |
| Belgium Goals |
Poisson for # of goals per team |
39.53% |
36.69% |
17.02% |
5.27% |
1.22% |
0.23% |
| 0 |
24.89% |
9.84% |
9.13% |
4.24% |
1.31% |
0.30% |
0.06% |
| 1 |
34.61% |
13.68% |
12.70% |
5.89% |
1.82% |
0.42% |
0.08% |
| 2 |
24.07% |
9.52% |
8.83% |
4.10% |
1.27% |
0.29% |
0.05% |
| 3 |
11.16% |
4.41% |
4.09% |
1.90% |
0.59% |
0.14% |
0.03% |
| 4 |
3.88% |
1.53% |
1.42% |
0.66% |
0.20% |
0.05% |
0.01% |
| 5 |
1.08% |
0.43% |
0.40% |
0.18% |
0.06% |
0.01% |
0.00% |
| Event |
Percentage |
| Finland Win |
25.04% |
| Draw |
27.27% |
| Belgium Win |
47.33% |
| Finland Win >= 2 Goals |
8.61% |
| Belgium Win >= 2 Goals |
22.70% |
| Over 2.5 Goals |
8.24% |
Belgium are favourites here with 47.3% probability of winning.
Belgium were turgid in the first half against Denmark but proved their quality in the second half. With Kevin de Bruyne back to his best, we can expect Belgium to create a lot of chances. Finland aren’t the greatest team and after suffering the 1-0 loss against Russia, there should not be a shock in this game. We expect a Belgian victory even if they do not play to their best and they will collect maximum points in their group. Finland 0-2 Belgium
Group B: Denmark vs Russia (Home Advantage)
Weighted xG (1.95 - 1.22) /
Weighted xGA (0.95 - 1.17)
| |
Denmark goals |
0 |
1 |
2 |
3 |
4 |
5 |
| Russia Goals |
Poisson for # of goals per team |
14.23% |
27.74% |
27.05% |
17.58% |
8.57% |
3.34% |
| 0 |
29.62% |
4.21% |
8.22% |
8.01% |
5.21% |
2.54% |
0.99% |
| 1 |
36.04% |
5.13% |
10.00% |
9.75% |
6.34% |
3.09% |
1.20% |
| 2 |
21.92% |
3.12% |
6.08% |
5.93% |
3.85% |
1.88% |
0.73% |
| 3 |
8.89% |
1.27% |
2.47% |
2.41% |
1.56% |
0.76% |
0.30% |
| 4 |
2.70% |
0.38% |
0.75% |
0.73% |
0.48% |
0.23% |
0.09% |
| 5 |
0.66% |
0.09% |
0.18% |
0.18% |
0.12% |
0.06% |
0.02% |
| Event |
Percentage |
| Denmark Win |
52.96% |
| Draw |
21.96% |
| Russia Win |
23.43% |
| Denmark Win >= 2 Goals |
30.29% |
| Russia Win >= 2 Goals |
9.29% |
| Over 2.5 Goals |
19.71% |
Similar to the Switzerland-Turkey game, the most probable outcome is a 1-1 draw but Denmark are favourites here due to the number of chances they created. In the past 2 games against Finland and Belgium, they registered an xG greater than 2. In their final group game back at home in Copenhagen, Denmark will be determined to win their first game of the tournament in front of their fans.
Denmark very nearly shocked Belgium last matchweek, but still showed a fantastic team display despite being outclassed in the second half. They know that a huge margin of victory can boost their chances of qualifying, so would go out to dominate the game. The Russians may be happy to sit back and without Eriksen, would the Danes have enough creativity to break down the Russians? We believe the Danes have enough firepower and with an attacking mindset from the start, wear down the Russians over the course of 90 mins. Denmark 3-1 Russia
Group C: Ukraine vs Austria (Neutral)
Weighted xG (1.70 - 1.22) /
Weighted xGA (1.42 - 1.13)
| |
Ukraine goals |
0 |
1 |
2 |
3 |
4 |
5 |
| Austria Goals |
Poisson for # of goals per team |
18.27% |
31.06% |
26.40% |
14.96% |
6.36% |
2.16% |
| 0 |
29.52% |
5.39% |
9.17% |
7.79% |
4.42% |
1.88% |
0.64% |
| 1 |
36.02% |
6.58% |
11.19% |
9.51% |
5.39% |
2.29% |
0.78% |
| 2 |
21.97% |
4.01% |
6.82% |
5.80% |
3.29% |
1.40% |
0.47% |
| 3 |
8.93% |
1.63% |
2.77% |
2.36% |
1.34% |
0.57% |
0.19% |
| 4 |
2.73% |
0.50% |
0.85% |
0.72% |
0.41% |
0.17% |
0.06% |
| 5 |
0.66% |
0.12% |
0.21% |
0.18% |
0.10% |
0.04% |
0.01% |
| Event |
Percentage |
| Ukraine Win |
47.84% |
| Draw |
23.90% |
| Austria Win |
27.30% |
| Ukraine Win >= 2 Goals |
25.25% |
| Austria Win >= 2 Goals |
11.09% |
| Over 2.5 Goals |
16.19% |
Ukraine appear to be favourites according to the score matrix and this is due the 4 goals they have already scored this campaign (only Italy, Netherlands and Belgium have scored more).
The 23rd and 24th ranked teams in the world face off, with both teams on 3 points going into the game. Arnautovic’s return would be a welcome boost for Austria, but there seems to be little to separate the sides, with talents across the pitch on both teams. We are going to go with a draw as nothing may split the teams. Both teams might be content with a point as 4 points would be enough to guarantee them a place in the Round of 16. Ukraine 1-1 Austria
Group C: Netherlands vs North Macedonia (Home Advantage)
Weighted xG (2.46 - 1.30) /
Weighted xGA (0.63 - 1.31)
| |
Netherlands goals |
0 |
1 |
2 |
3 |
4 |
5 |
| North Macedonia Goals |
Poisson for # of goals per team |
8.52% |
20.98% |
25.83% |
21.21% |
13.06% |
6.44% |
| 0 |
27.36% |
2.33% |
5.74% |
7.07% |
5.80% |
3.57% |
1.76% |
| 1 |
35.46% |
3.02% |
7.44% |
9.16% |
7.52% |
4.63% |
2.28% |
| 2 |
22.98% |
1.96% |
4.82% |
5.94% |
4.87% |
3.00% |
1.48% |
| 3 |
9.93% |
0.85% |
2.08% |
2.56% |
2.11% |
1.30% |
0.64% |
| 4 |
3.22% |
0.27% |
0.67% |
0.83% |
0.68% |
0.42% |
0.21% |
| 5 |
0.83% |
0.07% |
0.17% |
0.22% |
0.18% |
0.11% |
0.05% |
| Event |
Percentage |
| Netherlands Win |
59.05% |
| Draw |
18.28% |
| North Macedonia Win |
18.50% |
| Netherlands Win >= 2 Goals |
37.77% |
| North Macedonia Win >= 2 Goals |
7.30% |
| Over 2.5 Goals |
28.25% |
Netherlands are clear favourites here with an overwhelming 59% probability of winning. The most probable scoreline is 2-1 win but the 37.8% probability of a 2 or greater goal margin for Netherlands is one of the highest amongst the fixtures here. This is also aided with their fans cheering them on in their final group game.
The Netherlands have already topped their group and we expect a rotated squad, but still proving enough quality to dismantled an already eliminated North Macedonian side. We will be going for a Netherlands win with 2 goal margin, but could potentially be more. Netherlands 2-0 North Macedonia
Group D: England vs Czech Republic (Home Advantage)
Weighted xG (1.11 - 1.49) /
Weighted xGA (0.85 - 1.22)
| |
England goals |
0 |
1 |
2 |
3 |
4 |
5 |
| Czech Republic Goals |
Poisson for # of goals per team |
28.80% |
35.85% |
22.31% |
9.26% |
2.88% |
0.72% |
| 0 |
24.04% |
6.93% |
8.62% |
5.36% |
2.23% |
0.69% |
0.17% |
| 1 |
34.27% |
9.87% |
12.29% |
7.65% |
3.17% |
0.99% |
0.25% |
| 2 |
24.42% |
7.03% |
8.76% |
5.45% |
2.26% |
0.70% |
0.18% |
| 3 |
11.60% |
3.34% |
4.16% |
2.59% |
1.07% |
0.33% |
0.08% |
| 4 |
4.13% |
1.19% |
1.48% |
0.92% |
0.38% |
0.12% |
0.03% |
| 5 |
1.18% |
0.34% |
0.42% |
0.26% |
0.11% |
0.03% |
0.01% |
| Event |
Percentage |
| England Win |
32.71% |
| Draw |
25.86% |
| Czech Republic Win |
40.90% |
| England Win >= 2 Goals |
13.82% |
| Czech Republic Win >= 2 Goals |
19.27% |
| Over 2.5 Goals |
12.74% |
The score matrix put the Czechs as favourites here to beat England at 40.9%. They are however playing at Wembley which could potentially tip the scale to the English.
The English were disappointing against Scotland, with poor performances by many players and showing little signs of creativity. Southgate’s tactical decisions and substitions were questionable. Although expectations will be high for the English (and pressure will be high on Southgate) to put in a good shift against the Czechs, the Czechs are no pushover. They have demonstrated ability to defend well and convert their chances. England will dominate the game with most of the possession, but we fancy the Czechs to take the game to the English and shock Wembley with a victory. England 1-2 Czech Republic
Group D: Scotland vs Croatia (Home Advantage)
Weighted xG (1.11 - 1.49) /
Weighted xGA (1.33 - 0.97)
| |
Scotland goals |
0 |
1 |
2 |
3 |
4 |
5 |
| Croatia Goals |
Poisson for # of goals per team |
33.04% |
36.59% |
20.26% |
7.48% |
2.07% |
0.46% |
| 0 |
22.49% |
7.43% |
8.23% |
4.56% |
1.68% |
0.47% |
0.10% |
| 1 |
33.56% |
11.09% |
12.28% |
6.80% |
2.51% |
0.69% |
0.15% |
| 2 |
25.03% |
8.27% |
9.16% |
5.07% |
1.87% |
0.52% |
0.11% |
| 3 |
12.45% |
4.11% |
4.56% |
2.52% |
0.93% |
0.26% |
0.06% |
| 4 |
4.64% |
1.53% |
1.70% |
0.94% |
0.35% |
0.10% |
0.02% |
| 5 |
1.39% |
0.46% |
0.51% |
0.28% |
0.10% |
0.03% |
0.01% |
| Event |
Percentage |
| Scotland Win |
28.04% |
| Draw |
25.82% |
| Croatia Win |
45.61% |
| Scotland Win >= 2 Goals |
10.86% |
| Croatia Win >= 2 Goals |
22.47% |
| Over 2.5 Goals |
11.71% |
Croatia are favourites in this game with a 45.61% probability of winning. Scotland have an advantage playing at home at Hampden Park.
Scotland dominated the game against England and will feel hard done to have not come away with more, whilst Croatia disappointed against the Czechs. Tierney’s return to the Scottish side proved important as he made plenty of offensive and defensive runs, whilst Gilmour was outstanding throughout the game. Croatia may have the better midfield, but Scotttish tenacity and heart may see them overwhelm the Croats, especially if they’re buoyed on by a raucous Hampden Park. We are tipping the Scots to finally break their duct and emerge with a shock and narrow victory. Scotland 2-1 Croatia
Group E: Sweden vs Poland (Neutral)
Weighted xG (1.40 - 1.32) /
Weighted xGA (1.55 - 1.59)
| |
Sweden goals |
0 |
1 |
2 |
3 |
4 |
5 |
| Poland Goals |
Poisson for # of goals per team |
24.54% |
34.48% |
24.21% |
11.34% |
3.98% |
1.12% |
| 0 |
25.34% |
6.22% |
8.74% |
6.14% |
2.87% |
1.01% |
0.28% |
| 1 |
34.79% |
8.54% |
11.99% |
8.42% |
3.94% |
1.39% |
0.39% |
| 2 |
23.88% |
5.86% |
8.23% |
5.78% |
2.71% |
0.95% |
0.27% |
| 3 |
10.92% |
2.68% |
3.77% |
2.65% |
1.24% |
0.43% |
0.12% |
| 4 |
3.75% |
0.92% |
1.29% |
0.91% |
0.43% |
0.15% |
0.04% |
| 5 |
1.03% |
0.25% |
0.35% |
0.25% |
0.12% |
0.04% |
0.01% |
| Event |
Percentage |
| Sweden Win |
38.76% |
| Draw |
25.65% |
| Poland Win |
35.02% |
| Sweden Win >= 2 Goals |
17.94% |
| Poland Win >= 2 Goals |
15.44% |
| Over 2.5 Goals |
13.53% |
The score matrix puts the Swedes as slight favourites but it looks like a really even game.
The Swedes may feel a tad lucky to have won their previous game, and may come into this game a little cautious, knowing that every point may be crucial to them. They have shown an ability to defend really well. The Poles should be buoyed by their 1-1 draw against the Spanish. It may prove to be a cagey affair with plenty of half-chances for both sides, and we are predicting a draw. Sweden 1-1 Poland
Group E: Spain vs Slovakia (Home Advantage)
Weighted xG (2.69 - 1.11) /
Weighted xGA (0.98 - 1.43)
| |
Spain goals |
0 |
1 |
2 |
3 |
4 |
5 |
| Slovakia Goals |
Poisson for # of goals per team |
6.77% |
18.23% |
24.54% |
22.03% |
14.83% |
7.99% |
| 0 |
32.82% |
2.22% |
5.98% |
8.06% |
7.23% |
4.87% |
2.62% |
| 1 |
36.57% |
2.48% |
6.67% |
8.97% |
8.06% |
5.42% |
2.92% |
| 2 |
20.37% |
1.38% |
3.71% |
5.00% |
4.49% |
3.02% |
1.63% |
| 3 |
7.56% |
0.51% |
1.38% |
1.86% |
1.67% |
1.12% |
0.60% |
| 4 |
2.11% |
0.14% |
0.38% |
0.52% |
0.46% |
0.31% |
0.17% |
| 5 |
0.47% |
0.03% |
0.09% |
0.12% |
0.10% |
0.07% |
0.04% |
| Event |
Percentage |
| Spain Win |
65.16% |
| Draw |
15.90% |
| Slovakia Win |
13.23% |
| Spain Win >= 2 Goals |
44.42% |
| Slovakia Win >= 2 Goals |
4.65% |
| Over 2.5 Goals |
27.63% |
The score matrix puts the Spaniards as overwhelming favourites with a 65% probability to win! We know that they can create chances with an xG of 2.89 against Sweden and 3.17 against Poland. However, their problem has been the inability to convert in front of goal. They will be cheered on by their increasingly frustrated fans in Seville.
The Spaniards know how crucial a victory in this game will be, and the margin of victory may matter as well after a disappointing and wasteful performance against Poland. The Spaniards need to take the chances they create, especially against a resolute Slovak defence. We have confidence that despite misfirings in the past, the Spaniards will have the goods to show for when it matters in this game. Spain 2-0 Slovakia
Group F: Germany vs Hungary (Home Advantage)
Weighted xG (1.83 - 1.06) /
Weighted xGA (0.94 - 1.88)
| |
Germany goals |
0 |
1 |
2 |
3 |
4 |
5 |
| Hungary Goals |
Poisson for # of goals per team |
16.02% |
29.34% |
26.86% |
16.40% |
7.51% |
2.75% |
| 0 |
34.48% |
5.52% |
10.12% |
9.26% |
5.66% |
2.59% |
0.95% |
| 1 |
36.71% |
5.88% |
10.77% |
9.86% |
6.02% |
2.76% |
1.01% |
| 2 |
19.54% |
3.13% |
5.73% |
5.25% |
3.21% |
1.47% |
0.54% |
| 3 |
6.94% |
1.11% |
2.03% |
1.86% |
1.14% |
0.52% |
0.19% |
| 4 |
1.85% |
0.30% |
0.54% |
0.50% |
0.30% |
0.14% |
0.05% |
| 5 |
0.39% |
0.06% |
0.12% |
0.11% |
0.06% |
0.03% |
0.01% |
| Event |
Percentage |
| Germany Win |
65.16% |
| Draw |
15.90% |
| Hungary Win |
13.23% |
| Germany Win >= 2 Goals |
44.42% |
| Hungary Win >= 2 Goals |
4.65% |
| Over 2.5 Goals |
27.63% |
Germany are favourites in this game with at 54.19% probability to win but we are also looking at a high probability of a big margin of victory.
Following what was perhaps the performance of the matchweek, Germany look to have found their match winning formula. Hungary’s resilience were really impressive, but Germany’s dominance against Portugal was a sight to behold. Expect Hungary to sit deep and aim to hit on the counter like they did against France, but if Germany can exploit the widths and provide high quality deliveries like they did against Portugal, it would be a totally one-sided display. Germany 4-0 Hungary
Group F: Portugal vs France (Neutral)
Weighted xG (2.42 - 1.71) /
Weighted xGA (1.28 - 0.87)
| |
Portugal goals |
0 |
1 |
2 |
3 |
4 |
5 |
| France Goals |
Poisson for # of goals per team |
8.86% |
21.48% |
26.02% |
21.02% |
12.74% |
6.17% |
| 0 |
18.12% |
1.61% |
3.89% |
4.72% |
3.81% |
2.31% |
1.12% |
| 1 |
30.95% |
2.74% |
6.65% |
8.06% |
6.51% |
3.94% |
1.91% |
| 2 |
26.43% |
2.34% |
5.68% |
6.88% |
5.56% |
3.37% |
1.63% |
| 3 |
15.05% |
1.33% |
3.23% |
3.92% |
3.16% |
1.92% |
0.93% |
| 4 |
6.43% |
0.57% |
1.38% |
1.67% |
1.35% |
0.82% |
0.40% |
| 5 |
2.20% |
0.19% |
0.47% |
0.57% |
0.46% |
0.28% |
0.14% |
| Event |
Percentage |
| Portugal Win |
50.06% |
| Draw |
19.25% |
| France Win |
26.20% |
| Portugal Win >= 2 Goals |
30.24% |
| France Win >= 2 Goals |
12.23% |
| Over 2.5 Goals |
35.18% |
The stats put the Portugese as favourites for this game and this is simply down to the lack of chances created by France.
France were not fantastic against Hungary, spurning a couple of chances but also not creating as many chances as expected. Portugal always seem to score but their defensive frailties against Germany must be worrying for Fernando Santos. We expect Portugal to carve out enough opportunities to score, whilst France would have to dominate the midfield and have enough successful take-ons to trouble the Portuguese. If France’s attack does not gel more by the time this game comes around, we have a sneaky feeling that France would rue missed chances and get outscored by Portugal. This should be a hugely entertaining match with everything to play for in this group. Portugal 3-2 France
All the best and as always, beers are always welcomed!
15 Jun 2021
Following on from our relative successful first round of predictions (8 out of 12 outcomes correct with 3 accurate scoreline predictions), we are back with popular demand to predict the next round of fixtures! We will be adopting the same methodology as detailed in our previous post.

The Italians kicked of Euro 2020 in style! Who will be the next round of winners and losers in Matchweek 2?
Our Predictions
Group A : Turkey vs Wales
Weighted xG (0.923 - 1.17) /
Weighted xGA (0.777 - 1.74)
Turkey did not have the best game against Italy mustering an xG of only 0.4. They did however show defensive solidarity for the first half. Wales would be a much easier outfit to face as they did not provide much threat in their game against Switzerland. If not for Danny Ward’s heroics, the results could have been really bad. Although Turkey has a lower xG compared to Wales, they have shown the ability to convert their chances better than the Welsh. We fancy Turkey to edge this encounter. Turkey 2-1 Wales.
Group A : Italy vs Switzerland
Weighted xG (2.30 - 2.13) /
Weighted xGA (0.528 - 1.10)
The Italians scored 3 goals in a single Euros match for the first time ever, but could have easily had more against the Turks. The Italian’s midfield dominated the game with slick passing moves, and we expect them to control the midfield battle and overrun the Swiss. Despite relatively close xG values, we believe that the Italian’s resolute defence (higher xGA) of the Italians will play a strong part in this match to nullify most Swiss attacks. Italy 3-1 Switzerland.
Group B : Finland vs Russia
Weighted xG (0.81 - 1.04) /
Weighted xGA (1.84 - 1.05)
Despite their shock 1-0 win over the Danes, the Finnish exhibited one of the worse offensive performance of the first round, mustering a total of only 0.47 xG (just better than the Turks). Russia did not have a good outing against the Belgiums. The Russians have the higher xG, and stand higher in the goals over xG chart. We fancy Russia to be the slightly stronger team and come away with a narrow victory. Finland 0-1 Russia.
Group B : Denmark vs Belgium
Weighted xG (1.81 - 1.57) /
Weighted xGA (0.937 - 0.865)
A tough one to call given what happened in the Finland game must have affected the Danes massively. Both teams have really similar xG and xGA statistics. The Danes would definitely want to come flying out of the blocks after their loss to Finland under such unfortunate circumstances. However, with Belgium still right at the top of the goals over xG chart, we expect the in-form Lukaku to lead the Belgiums to victory. The Belgians know they have to go out and do a job, and we expect a professional performance from the Belgians resulting in a well-deserved win. Denmark 0-2 Belgium.
Group C: Ukraine vs North Macedonia
Weighted xG (1.63 - 1.28) /
Weighted xGA (1.26 - 0.931)
Ukraine do not have many goals in them (they are the 2nd worse clinical team), but are solid defensively. North Macedonia will be keen to emerge with a point and which may see them content to sit back and allow Ukraine to attack. This is potentially a game with a few moments of quality up top and we believe that North Macedonia will get away with their first point of the competition.
Ukraine 1-1 North Macedonia.
Group C: Netherlands vs Austria
Weighted xG (2.64 - 1.35) /
Weighted xGA (0.715 - 1.02)
We incorrectly predicted an upset the previous round against the Dutch but it nevertheless was a close game against Ukraine. With a much more superior xG, the Dutch will create lots of chances in the game and would inevitably put some away. However, the question is if they have the mettle to keep the opposition out. We think they just about have too much quality for Austria in this game. Netherlands 2-1 Austria.
Group D: Croatia vs Czech Republic
Weighted xG (1.67 - 1.56) /
Weighted xGA (0.845 - 1.17)
A roughly tough game to call as once again, we found a pair of opposition that have very similar xG and xGA stats. The Czechs showed their experience in their 2-0 victory over the Scots while Croatia, despite losing 1-0, continued to rake in chances with a superior xG against the English. The key to this game will be the midfield battle, and the Czech midfield is not good enough. The Czechs did concede a high xG against the Scots and the clinical Croats will not be too kind. The Czechs may nick a goal through a counter or a set piece, but Croatia should still triumph.
Croatia 2-1 Czech Republic.
Group D: England vs Scotland
Weighted xG (1.25 - 1.34) /
Weighted xGA (0.827 - 1.18)
A fierce national rivalry which seems lopsided on paper, but could easily descent into a cagey game. England has been struggling to create chances in their most recent games, with their xG gradually dropping in the last 4 games. Scotland will be fired up after their 2-0 lose. We believe that the difference in quality of attackers will be decisive and England will emerge as victors. Scotland will struggle to create many opportunities and we do not see them finding a way past the English defence. England 2-0 Scotland.
Group E: Sweden vs Slovakia
Weighted xG (1.33 - 1.11) /
Weighted xGA (1.63 - 1.35 )
The Slovaks seem to be quite an inconsistent outfit, whilst the Swedes seem to be able to do a job against lesser opposition. It will be a close game but expect the Swedes to prevail. Sweden should edge this out with a slightly stronger weighted xG and xGA.
Sweden 2-0 Slovakia.
Group E: Spain vs Poland
Weighted xG (2.32 - 1.37) /
Weighted xGA (0.749 - 0.819)
Spain were left to rue their missed chances (yet again) as they came away with a tame 0-0 draw against the Swedes despite having an xG if 2.89! (2nd highest of all Matchday 1 fixtures). The Poles will also be seeking their first win after their disappointing loss against the Slovaks. Spain have quality in midfield, but need to be able to tuck away the chances they will inevitably create. We believe that the Spanish will finally kick off their Euro campaign with a victory. Spain 2-1 Poland.
Group F: Hungary vs France
Weighted xG (1.31 - 1.50) /
Weighted xGA (1.55- 0.956)
Hungary may prove tough to break down, but France have simply too much talent that you expect them to win almost any game. Despite this, France did not create much against the Germans, mustering a total of 0.31 xG and thus pulling down their weighted xG. France will be hoping to improve their goal difference against the weakest team in the Group of Death but we are not expecting a thrashing. Hungary 0-2 France.
Group F: Portugal vs Germany
Weighted xG (2.78 - 1.65) /
Weighted xGA (0.655 - 0.779)
Both teams know that this game could prove crucial in getting through to the next round. Germany had a positive performance against the French despite a 1-0 loss where they generated an xG of 1.32. Portugal had a terrific game against Hungary, mustering a total of 3.08 xG despite only opening the scoring in the 84th minute against the Hungarians. We think Portugal’s exciting squad (especially in midfield) would and the German’s lack of a world class number 9 will be the deciding factor in this game. Portugal 2-1 Germany.
All the best and as always, beers are always welcomed!
07 Jun 2021
In the spirit of the Euro 2020 (or 2021) Championships, Ashley and I decided to whip out our crystal balls to predict some of the results in the first round of fixtures. The objectives are simple - beat Paul the Octopus and also emerge victorious in our respective Fantasy leagues. We have a slight advantage in the form of data (albeit limited) and a cognitive understanding of the game although these predictions will probably not be worth more than the $4.5 Million Paul was valued at.
Methodology
Our methodology is very loosely based on analysing the most recent performances of individual teams across the international friendlies, World Cup qualifiers and Nations League competition. Metrics used to analyse performances are Expected Goals (xG) and Expected Goals Against (xGA). xG values were kindly provided by footystats.org. xG is used to determine the team’s offensive capabilities based on shot quality. As mentioned in my earlier posts, they are a regression model that measures the quality of a shot based on features such as distance to goal, angle of shot, number of defenders between the shot and goal etc. xGA helps to rate their defensive capabilities by considering the opponent’s xG (aka the quality of shots conceded). In simple terms, a higher xG relates to a better offensive output while a lower xGA is a stronger defensive display.
We then analysed the performance of the xG model in relation to the actual result. This helps to identify not only the reliance of the xG model, but more importantly how clinical the teams are in attack. The following were the results we got:
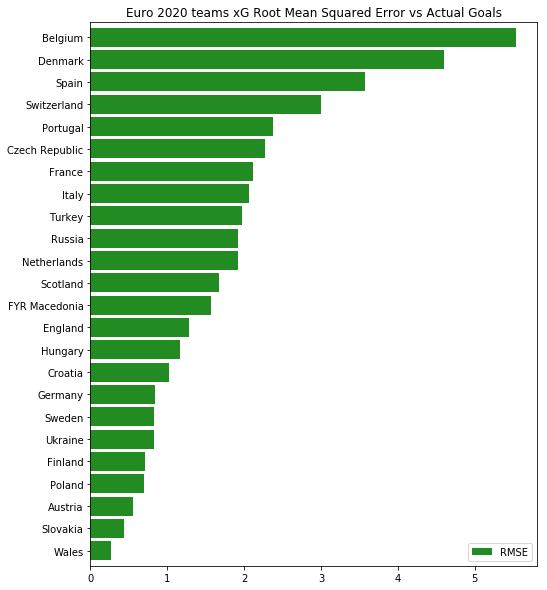
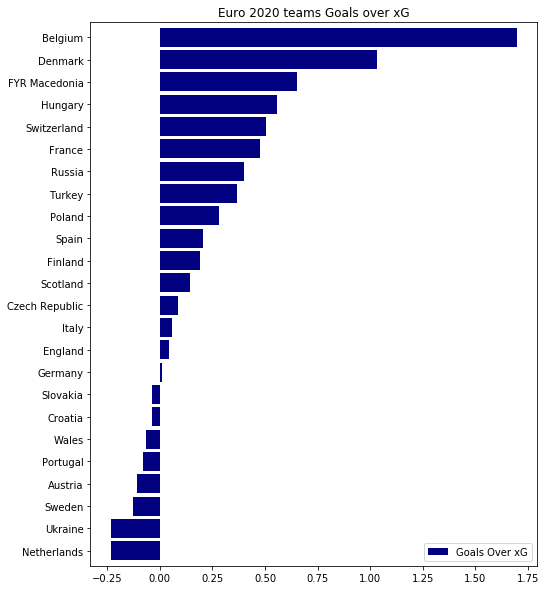
Root Mean Squared Error vs xG (L) and Actual Goals over xG modelled (R) per team
On the left, we calculated the Root Mean Squared Error (RMSE) of the xG values versus the actual goals scored. The RMSE measures the average deviation (both positive and negative) of xG from the actual numbers of goals scored. This helps to identify if the xG model was a good predictor of the actual number of goals scored. On the right, we have a simple illustration of the xG over actual goals scored. This provides an indication if the xG model has been underpredicting (a high goals over xG) or overpredicting (a negative goals over xG) the team’s goalscoring prowess. Both plots will need to be used hand in hand to analyse the teams performance. Denmark and Belgium immediately stand up at the top of the chart, with high RMSE and Goals over xG. With a highly in-form Romelu Lukaku and Kevin de Bruyne behind him, it is hardly suprising to see Belgium being so ruthless in taking their chances. Denmark also boost prolific goalscorers in their ranks (Olsen, Dolberg and of course the legendary Braithwaite) and their 8-0 thumping of Moldova did massively boost their Goals over xG record.
With this analysis, we calculated a weighted xG and weighted xGA that accounts for form by giving a heavier weightage to the most recent games (wow data science). Of course, with all these numbers, it is not pragmatic to predict a 2.53 - 1.5 victory for England against Croatia so we employed a little bit of our knowledge of the games. It is also important to note that international tournaments have this magical factor of regular upsets and surprises (South Korea 2002, Greece 2004, etc.) that do not come so often in friendlies or qualifiers. We also want to highlight that the Goals over xG values are very much dependent on the quality of oppositions the team is facing (eg. thrashing a team (who has a part-time dentist, part-time player in goal) 11-0 will greatly skew this metric. Our predictions will therefore be very much dependent on both what the data is telling us and our understanding of the game. With this, lets get to our predictions!
Our Predictions
Group A : Turkey vs Italy
Weighted xG (1.41 - 2.00) /
Weighted xGA (1.20 - 0.648)
A tough game to call as Turkey should prove a tougher prospect than neutrals may suspect for Euro dark horses Italy. The xG model predicts Italy’s xG pretty well while it does show that Turkey has been scoring higher than their xG values (about 0.5). However, with a superior defensive record (2nd lowest xGA), we fancy Italy to just about scrape through with a dogged performance. Turkey 0-2 Italy.
Group A : Wales vs Switzerland
Weighted xG (1.23 - 1.98) /
Weighted xGA (1.44 - 1.13)
The xG model shows that Wales are less clinical in converting their chances while Switzerland are one of the top 5 clinical teams. This match between 2 decent sides without much star power in a star-studded euros, both teams would not want to lose their opening game which may result in a cagey draw.Wales 1-1 Switzerland.
Group B : Denmark vs Finland
Weighted xG (1.39 - 0.939) /
Weighted xGA (1.13 - 1.49)
As indicated by the model, the Danes are one of the most clinical teams in the tournament. The Danes should have enough quality to comfortably see off a Finnish side which are one of the weaker teams at the tournament (both one of the lowest xG and highest xGA). No surprises here. Denmark 2-0 Finland.
Group B : Belgium vs Russia
Weighted xG (1.60 - 1.17) /
Weighted xGA (0.871 - 1.05)
The Red Devils need to have something to show for their golden generation, and this tournament might be their best bet. Questions remain about their depth defensively, but we expect them to take the game to Russia and just have too much quality offensively as seen in the graphs above. We believe they will continue their fine form into the opening match. Belgium 3-0 Russia.
Group C: Austria vs North Macedonia
Weighted xG (1.58 - 1.69) /
Weighted xGA (1.25 - 0.993)
North Macedonia, one of the weakest teams in the tournament, could be a surprise package. The graphs indicate a very efficient conversion of chances which included that shock 2-1 victory over the Germans. Their xG are also pretty high (granted they played Liechtenstein and Kazakhstan). Austria on the other hand, have displayed a lower ability to convert their chances and lower xG. North Macedonia have lost their previous 2 encounters with the Austrians, but opening matchday fixtures can prove to be tense affairs, where we are backing a low-quality game ending in a goalless draw. Austria 0-0 North Macedonia.
Group C: Netherlands vs Ukraine
Weighted xG (2.87 - 1.83) /
Weighted xGA (0.543 - 0.911)
This could be a tricky one considering the vast difference in xG and xGA between the 2 nations. The xG model also suggests that both teams are not as clinical in taking their chances, with the Dutch being the bottom team. Frank de Boer is seemingly out of his depth as the head coach, with plenty of off-pitch issues as well. A previous affair ended in a draw between the sides, but we are tipping the Dutch to have issues as a team and falling to a somewhat shock loss to Ukraine. Netherlands 1-2 Ukraine.
Group D: England vs Croatia
Weighted xG (1.65 - 1.99) /
Weighted xGA (0.747 - 0.942)
The xG model rather accurately predicts the goals scored for both teams so looking at the xG and xGA values, we can expect this to be a really closely contested affair. The English will be out for revenge against the Croats, especially with the past few years having been great for English youth development. Croatia are well drilled, but we expect a moment of magic by one of the English players to prove decisive. England 2-1 Croatia.
Group D: Scotland vs Czech Republic
Weighted xG (1.398 - 1.70) /
Weighted xGA (1.13 - 1.06)
Scotland seems to have a slightly better conversion of shots compared to their opponents. This match could prove pivotal in seeing which team finishes third in their group, and we think the Czechs have the slightly better players with more experience, coupled with a greater xG and lower xGA to come away with a win. Scotland 0-2 Czech Republic.
Group E: Poland vs Slovakia
Weighted xG (1.21 - 1.24) /
Weighted xGA (0.913 - 1.15)
Although Poland have a slightly lower xG compared to Slovakia, the model shows that they have been very clinical in converting their chances. We expect the Poles have enough talented players with a very much in form Robert Lewandowski playing at the highest level. They should see through this game against a weaker Slovakia side. Poland 2-0 Slovakia.
Group E: Spain vs Sweden
Weighted xG (1.99 - 1.38) /
Weighted xGA (0.531 - 1.02)
Spain may look like a promising team on paper with a high xG but we think they have not sufficiently addressed the cracks that saw them under-perform at the last World Cup. Historically, they have struggled to secure a result in their opening games of international tournaments (winning 1 out of the last 4). Sweden would be a resolute opposition, who may come away with a great point. Shock result number 2. Spain 1-1 Sweden.
Group F: Hungary vs Portugal
Weighted xG (1.77 - 2.53) /
Weighted xGA (0.862 - 1.08)
The current holders have to be tipped as outsiders for the title again this year, albeit having to come through a tough group first. Hungary, although being the 4th most clinical team, should prove no match for a Portugal side who have a higher xG and are filled with world class talents. Hungary 1-3 Portugal.
Group F: France vs Germany
Weighted xG (2.04 - 1.72) /
Weighted xGA (0.753 - 0.886)
This is perhaps the biggest fixture of the opening games. The shock inclusion of Benzema may prove costly if squad harmony is disrupted down the line, but there seems to be no issues currently for France. On the other hand, Joachim Low has outstayed his welcome for a couple of years, and his tactical naivety will cost Germany in the group of death. A very much in-form France with a high xG and efficiency in shot conversion should see France dispatch the Germans off in a thoroughly entertaining clash. France 3-1 Germany.

The biggest match of the opening fixture - France vs Germany; the French emerged as 2-0 victors in the 2016 European Tournament.
Closing words
This is it. The stage is set for a much anticipated tournament that has been pushed back a year! I will be rating my own predictions and refining them in subsequent fixtures! If you did use some of predictions to make a bet (whether for or against), or if you are feeling generous, feel free to buy us a beer here! All the best and of course, thank you for reading!
17 Apr 2021

When Arsenal hosted Liverpool on the 3rd of April 2021 at the Emirates, it would be Mikel Arteta’s 50th game in charge. The jury is still out on Arteta’s suitability for the role, with opinions on whether he is the right man for Arsenal generally split across the fanbase.
Going into the game, Arsenal were a somewhat in-form team after a crucial North London Derby victory over Tottenham Hotspur, and a morale boosting 3-3 comeback draw against a revitalized West Ham United outfit. The Liverpool side, who were nowhere near the highs of their Premier League and Champions League winning seasons, were there for the taking. Eventually, the Gunner’s insipid performance led to a humbling 3-0 loss, mustering a total of 0.09 xG (Expected Goals), of which 0.06 came from an offside attempt. Arsenal now sit 10th, 9 points off a European spot with the same number of wins and losses (12).
This performance succinctly summarized the kind of season Arsenal has had. It has been a roller coaster ride for Arsenal fans, with the Gunner’s Jekyll and Hyde performance delivering some memorable performances and even more frustrating ones. At times, it feels like certain performances can be determined by a 50-50 coin flip – you just never know which team is going to turn up!
The key question remains – is Arteta the right man for the job? Has he brought back (or is bringing back) an identity to the football club which was once synonymous with attractive attacking football?
In my attempt to answer such questions in the midst of the 2nd and 3rd lockdown here in the UK, I decided to turn to the data to see if they would tell me anything interesting. The data used in the following visualisations were scraped from whoscored.com and plots were visualised using Python (you can check out my rather messy code on my Github profile!). In this initial post, I will be introducing and discussing the use of passing networks to evaluate team performances. Subsequently, in my attempt to dethrone Jamie Carragher and Gary Neville from Sky Sports Monday Night Football, I will utilise my far from professional football knowledge and plots to assess Arteta’s performance.
Passing Networks
As the most fundamental and abundant action in a football game, passes are a perhaps a great initial way to evaluate the effectiveness of a team’s tactics. This is where passing networks bring in so much value as a simple illustration that can include many levels of dimensionality. This helps unveil crucial information on the organization of players (eg. Are there certain stronger partnerships on the team?) and evaluating player’s performances.
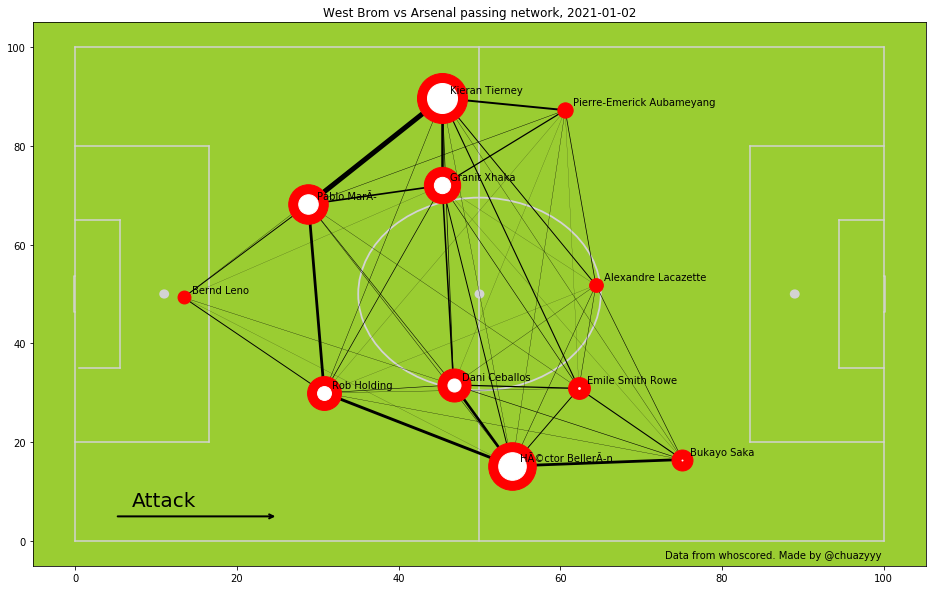
Football passing networks are constructed by observing the number of passes made between any 2 players of a team. Let’s look at an example passing network from the West Brom vs Arsenal game (I chose this because it was one of the more memorable Arsenal performances this season) above. In this diagram, the selected team (Arsenal) is attacking from left to right on a pitch bounded between \([0,100]\) coordinates on both the x and y axis. Each node corresponds to one of the 11 player’s position on the pitch. This is derived by calculating the median position of each player’s position on the pitch when a successful pass is made. The thickness of the lines (edges) between nodes represents the number of successful passes made between the 2 players. The size of the node itself represents the number of successful passes made by that player. Such a simple graphic can shed light on a team’s tactic and derive valuable insights such as:
- Eigenvalue centrality – which player or players are crucial for the network. Players with larger nodes are more involved in the teams build up play
- Identifying crucial partnerships - Which partnerships are crucial to a team’s build up? We can identify important passing lanes in the team by seeing which pair has the most passes between them.
- Average position on the pitch How advanced are the players on the pitch? Generally, more attacking teams have their player’s median position closer to the opposition’s box while defensive teams are packed closer to the back.
- Overall gameplan – Is the team’s tactic to build up slowly from the back, to get the ball to the wingers or full backs and attack the oppositions wing, or to hoof it up the field to a target man? Passing maps help to visualise this by identifying if passing nodes are highly skewed to a specific part of the pitch.
This list is by no means comprehensive, and there are so many more dimensions we can add to these networks to derive even more valuable insights.
All passes are equal, but some more than others
The usefulness of these maps can start to be limited as we start to demand more in-depth analysis of the game. One thing that strikes from analysing the passing network is the value and quality of a pass. In the above diagram, each successful pass is regarded as having the same value (1) and contributes equally to the size of the nodes. In reality, this is not the case – a simple 5 yard ground pass does not add the same value to a team’s build up play as compared to a 40 yard defense splitting through ball to put your striker in pole position to score. Teams with a focus on a slow build up from the back also tend to have more passes between the back 4 and the goalkeeper as compared to the rest of the players, and this is where we see skewed passing networks where the main passing nodes are the defenders. Passes between the defenders tend to be much shorter, more risk-free and unpressured as opposed to passes made up the pitch where attackers will have multiple opposition players closing down rapidly. There needs to be a way to reward passes based on how much value they can add to the buildup. In this instance, a good proxy of ‘rewarding’ these passes would be if these passes would help to increase the team’s probability of scoring.
Expected Goals (xG) and Expected Threat (xT)
Expected Goals (xG) is a well-known metric in the footballing community to measure the effectiveness of a team’s attack during the game. As football is such a low scoring game, the final score does not necessarily provide the full narrative of the game. xG was introduced as a statistical tool to measure the quality of chances created. This helps to build a narrative of the game where the team with higher xG in the match produced more quality chances and on the balance deserve to win the game. This involves building a Logistics Regression model based on historical shots and probability of them resulting in a goal. However, xG only measures the shots quality of a team. What about the actions that led to the creation of a chance? Or even actions that substantially improved a team’s chance of scoring but did not end up with a shot?
For this, I will have to thank Karun Singh for conceiving the idea of Expected Threat (xT). xT builds on the pure-shot model of xG to analyse the effectiveness of one’s buildup play. The idea involves breaking down the pitch into a 12 by 8 grid and deriving an xT value in each area.
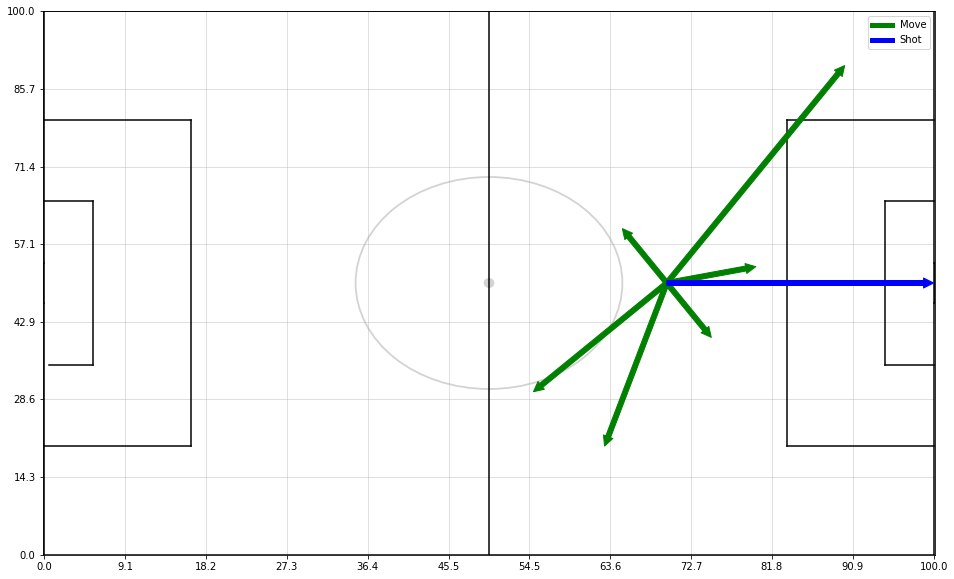
xT is predominantly made of 2 parts – one is the expected payoff (probability of scoring for simplicity) from shooting from that position while the other is a summation of payoffs of moving the ball to another location on the pitch and subsequently scoring from those positions. As seen above, at a point \([70,50]\), a player has the option to either move the ball (green) or shoot(blue) from that position. xT sums up the total threat made from moving the ball to each of the other 95 grids on the pitch and the probability of scoring from that position (xG). xT metric rewards the player for progressing the ball into a more advanced position where there is a higher probability of scoring, whilst penalising him if a pass resulted in a lower probability of scoring. For more details, check out my other post here on a bit more detail on xT derivation, and of course Karun’s awesome blogpost.

I will be incorporating the xT values Karun has kindly provided from the 2017-2018 Premier League season. The results are visualised on a 12 x 8 grid diagram above. This intuitively makes sense as a position closer to the opposition goal should have a higher xT associated.
A new dimension - xT weighted passing networks
With the xT values, we are now able to include an additional dimension to the passing network. The total xT generated per player was calculated by summing all successful passes made by that player. This total xT value is represented by the colour of the nodes. The colour scales are weighted from lighter to darkest with increasing xT values. Here we can see how the xT weighted passing network appears for the same game:
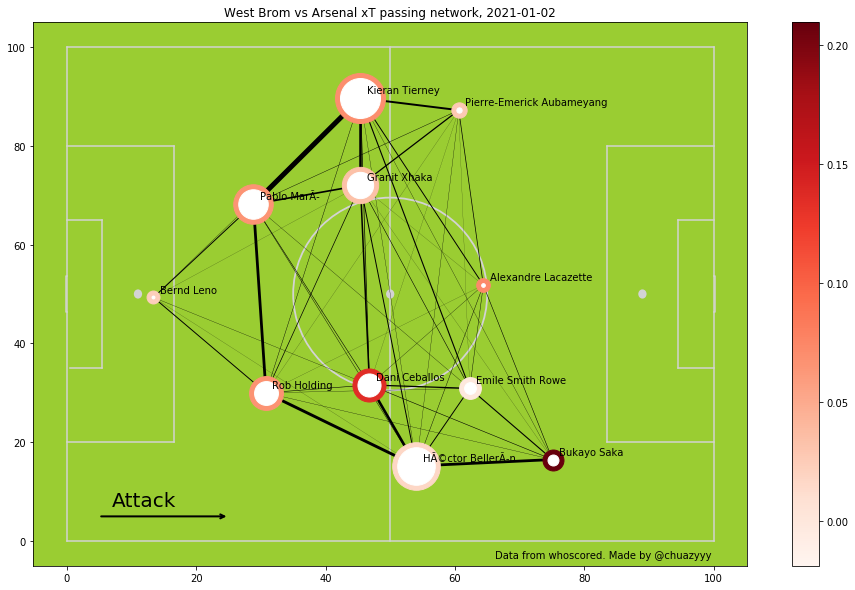
We can see that Saka was the immediate stand out performer despite having less passes than his colleagues. His average position on the pitch was also much more advanced compared to the others. Saka’s constant threat down the right flank this game yielded a goal along with a shout for a Man of the Match performance. We can also see Arsenal’s reliance on full backs Kieran Tierney and Hector Bellerin to attack as their positions were more advanced than the 2 midfielders. Tierney was particularly influential on the left flank, scoring a worldie and provided an assist to Alexandre Lacazette from the left flank. In this match, Arsenal’s game plan of threats along the flank worked out supremely well as they emerged as 4-0 victors. We can now see the effectiveness of such a passing map to evaluate and analyse a team’s attack.
xT is just one of the many footballing metrics out there being developed. The football analytics space is rapidly growing, with many analytics teams coming up with innovative ways to evaluate players performances, analyse team performances to give their clubs an edge. Other metrics include Valuing Actions by Estimating Probability (VAEP) framework which involves assigning a value to each on the ball movement and analysing its impact on the outcome of the game.
In conclusion
To answer the initial question I posed- much more analysis has to be conducted to grade Arteta’s performance but time is running out for him to turn the tide to his favour. He sorely needs something to change and bring in a good string of results to avoid a complete fan revolt come end of season.
Hopefully this post will provide a rather quick insight on the importance of passing maps and how dynamic they get when we add different dimensions like xT into the fray! Stay tuned for more!
16 Apr 2021
Deriving xT
This really short tutorial is meant to provide a really simplistic mathematical explanation and derivation of xT. Please check out Karun’s post for more details!
First, assume the player is in possession with the ball at a position x,y on the pitch. The expected threat value at that position is \(xT_{x,y}\). He has 2 options on the ball – move or shoot. Movement includes passing to a teammate or dribbling while shooting is self explanatory.
Shooting
The shooting element of xT is a form of the xG model. I will not be detailing the derivation of xG as this is heavily dependent on the model. For simplicity, xG represented in this section is \(g_{x,y}\). Here, we introduce a probability \(s_{x,y}\) which describes the probability of shooting from that position. We get the formula :
\[s_{x,y} \times g_{x,y}\]
Moving
When moving the ball, the player must decide which of the other 95 zones to move to. Assuming the new zone has coordinates z,w, the new expected threat value will be \(xT_{z,w}\) at this zone. Here, a transition matrix \(T_{x,y}\) is introduced. This transition matrix is derived from past data and describes the payoffs from moving the ball to the new coordinate z,w. In simpler terms, they describe the probability of shifting the ball to this position. Now with this, we can calculate the total payoff for moving the ball but summing it across all zones.
\[\begin{align*}
& m_{x,y} \times \sum_{z=1}^{12} \sum_{w=1}^{8}T_{(x,y)\rightarrow (z,w)} \times xT_{z,w}\
\end{align*}\]
Now, to combine both the shooting and movement elements of xT, we introduce 2 more probabilities – \(s_{x,y}\) which describes the probability of shooting from the location and \(m_{x,y}\) which is the probability of moving the ball. Combining them together, we get:
\[\begin{align*}
xT_{x,y} = (s_{x,y} \times g_{x,y}) + (m_{x,y} \times \sum_{z=1}^{12} \sum_{w=1}^{8}T_{(x,y)\rightarrow (z,w)} \times xT_{z,w})\
\end{align*}\]
The above formula looks seemingly impossible to solve at first as we do not know what are the values of \(xT\). Fortunately, there is a way to overcome this by setting \(xT_{x,y}\) = 0 at an intial position and then solving them iteratively until the values converge.


