Tis the season to find out who will be jolly
18 Nov 2022
All credits of this image goes to The Analyst.
In what would be Ronaldo and Messi’s last World Cup, who will emerge victorious? Will someone else clinch glory leaving these 2 players without the coveted trophy? In this controversial FIFA World Cup, where the tournament takes place in between the regular club season and in the winter months, the key question on everyone’s mind is what other surprises can this World Cup bring? Politics aside on where and how the World Cup is being hosted, lets put the focus back on football itself. After a long absence from playing with football data, I am back with fresh new ideas to predict and simulate the World Cup games!
If you have been following me from my posts back in the Euros, you will remember that I used a modified xG metric to build a poisson product matrix to determine the most likely outcome and results of a match between 2 teams (If not I recommend giving this post a read). This time, I utilised a modified approach which layers on the xG analysis done previously to simulate the entire tournament.
Methodology
This method involves predicting the future value of xG using Generalised Estimating Equations. A generalized estimating equation is a method of estimating parameters with the assumption that there is a dependence within clusters or groups. The model accounts for a within-subject correlation of responses on dependent variables which is essentially a \(TxT\) matrix. The type of distribution specified here is Poisson as we have studied previously that the distribution of goals (and xG) do follow a Poisson distribution. For more information on GEE, check out this github page post by Johnny Hong and Kellie Ottoboni here.
In the case of predicting football scores, the assumption is that there is a strong dependence of the xG generated per team and the opposition that they are facing. This intuitively makes sense as a team will more likely generate a greater xG playing against a weaker opposition versus a stronger opposition. In this analysis, each cluster/group will be a single match as the xG generated within the game is very much dependent on the opposition team.
The method mentioned above was first employed by Vladimir Dzyuba here with some modifications which I have introduced.
Elo Rankings
The Elo rating was developed for use in chess to rank and calculate the relative skill level of players by Dr Arpad Elo. It was used to predict the outcome of the match simply by measuring the ranking/rating of the chess players. Gradually its influence spread across to new sports like tennis, baseball and football.
The World Football Elo Ratings was developed and published on Eloratings.net and this will serve as our data source for our predictions. The Elo rating is based on the following formula:
\[R_{n} = R_{o} + K \times (W - W_{e})\]- \(R_{n}\) is the new rating
- \(R_{o}\) is the current rating (before the match is played)
- \(K\) is the weight constant depending on the the tournament to match is played in (higher weight given to more important tournaments). K is then further adjusted based on the goal difference in the game.
- \(W\) is the outcome of the game - 1 for a win, 0.5 for a draw and 0 for a loss.
- \(W_{e}\) is the expected result (win expectancy) from the formula \(W_{e} = 1/(10^{-dr/400} + 1)\) and \(dr\) equals the difference in ratings plus 100 points for a team playing at home.
The match looks complicated at first glance but in essence, the rating is recalculated after every game based on the whether the team has won, against who and by how much. For example, a victory against a weaker team with a smaller goal difference will result in a smaller increase in the Elo Rating as compared to a large victory against a significantly stronger team.
Data
Elo ratings were extracted from Eloratings.net and are updated as of 1 November 2022.
The xG values and goals scored per team were kindly provided by footystats.org. As there is this correlation between the elo rating and the xG / goals scored, it was essential that not too historic match data was used as that may otherwise may not be reflective of a team’s recent performances. Therefore, only data from all tournaments (international friendlies, regional cup competitions and qualifiers) since 2019 have been used. In total there are about 2,500 matches worth of training data.
Building the GEE model
With the xG and goals scored data, the training dataset for the GEE model can be constructed. A simple dataframe containing teams, opposition and the xG generated for the team was built after loads of data cleansing (removing cancelled matches, etc.). Each match generates 2 rows as in the example: Team A (xG = 2.15) vs Team B (xG = 1.2)
| Team | Opposition | xG |
|---|---|---|
| Team A | Team B | 2.15 |
| Team B | Team A | 1.2 |
The xG prediction model was built using the statsmodel python package which already contains the in-built statistics tools to build the prediction model. Here are the results of the model:
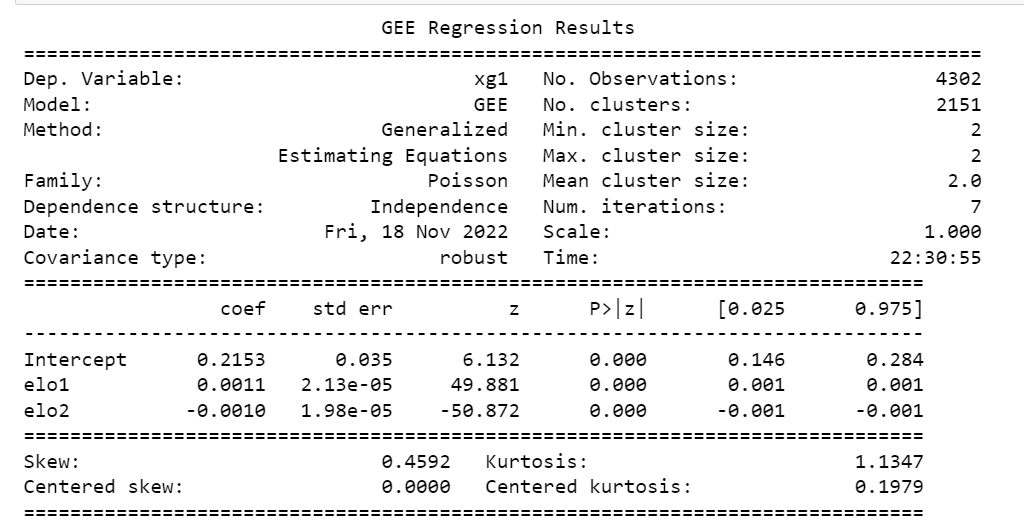
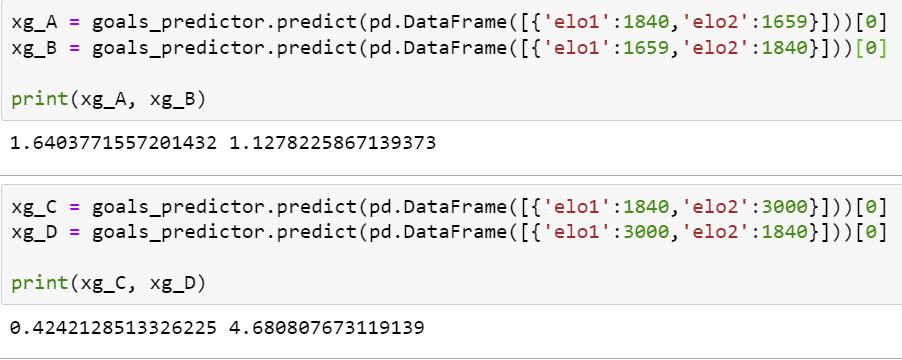
The model ran with 7 iterations with a cluster size of 2 (team and oppposition). By running a few test predictions, it also validated the assumption that a team will generate greater xG and concede less xG against a lower rated Elo rating team as compared to a higher rated team (phew!).
Deciding the winners, losers and most probable outcome
Now with the ability to determine the expected goals given a team-opposition pair, we can now construct a win probability matrix per match. This is similar to the analysis performed in my Euro predictions where the product of two probability mass functions (Poisson distribution) is used to determine a probability of the match score outcome. An example of one the games - England vs Iran can be shown below. The green section indicates the probability of an Iran victory, the red section is the probability of an England victory, and the amber section indicates a draw.
| England goals ↓/ Iran Goals → | 0 | 1 | 2 | 3 | 4 | 5 |
|---|---|---|---|---|---|---|
| 0 | 6.37% | 7.85% | 4.84% | 1.98% | 0.61% | 0.15% |
| 1 | 9.69% | 11.9% | 7.35% | 3.02% | 0.93% | 0.15% |
| 2 | 7.38% | 9.08% | 5.59% | 2.30% | 0.71% | 0.17% |
| 3 | 3.78% | 4.60% | 2.83% | 1.16% | 0.36% | 0.08% |
| 4 | 1.42% | 1.75% | 1.08% | 0.44% | 0.13% | 0.03% |
| 5 | 0.43% | 0.53% | 0.33% | 0.13% | 0.04% | 0.01% |
For the simulation of the group stage, we picked the most probable scores and in the knockout stage, the team with the highest probability of winning will be progressing to the next round.
The results!
Group stage
The most anticipated part of my post (probably) and here it is! These are the results of the group stages (Apologies for the gridlines):

More detailed head to head results can be found on my Juypter Notebook. Section 3.3 will show the group stage results while the results section at the end shows the entire tournament result.
Knockout stage
And here are the results from the knockout stage
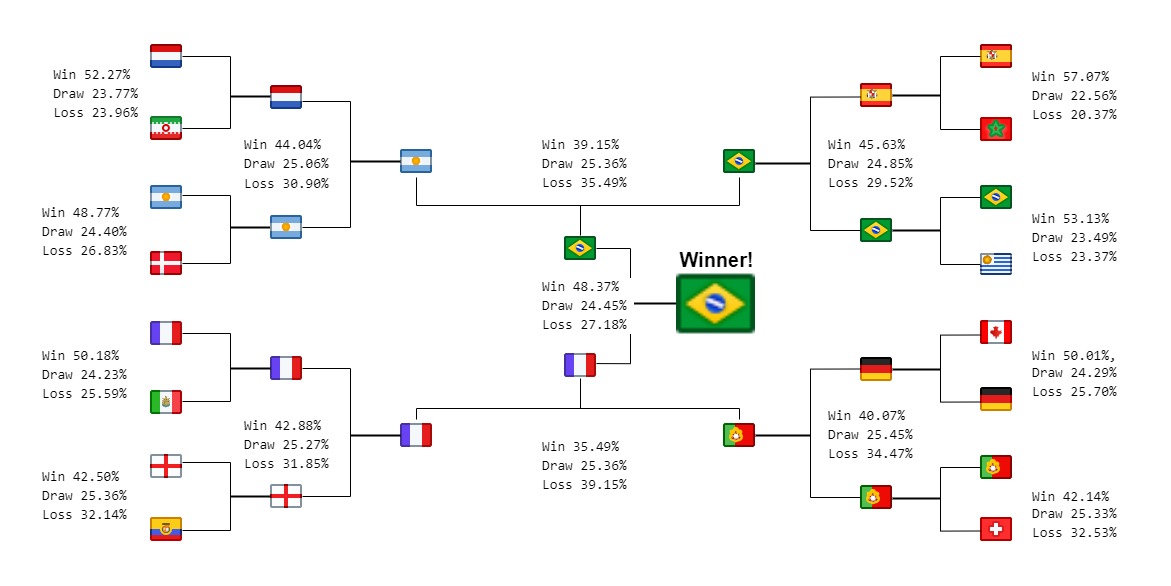
It looks like Neymar will lead Selecao to the first World Cup in 20 years! It will not be coming home for England as they look to be crashing out against France in the quarter finals. We will not be seeing a hotely anticipated Messi vs Ronaldo final as both will lose their respective games in the Semi Finals.
Observations
Some key observations during the analysis of the results:
-
Common scorelines in the group stage of 1-0 and 1-1. An explanation would be the proximity of probabilities in the 1 goal region. An interesting result is the England group where it appears that nearly all games will end with a 1-1 draw, with England and Iran qualifying to the next round.
-
Low scoring games. This is perhaps reflective of the xG data that we used to train the model. What was observed in our dataset was that international teams do tend to outperform their xG (61% of the matches) in number of goals scored. We should certainly hope that there will be more goals in the tournament!
-
High elo rating = favourites. This is perhaps quite obvious that the higher ranked Elo team tends to have a higher probability of winning (and hence Brazil being the top team emerging as world champions).
Monte Carlo simulation
The above simulation was just based on the outcome where we determined outcome based on the most expected scoreline and outcome of the match. Football is rarely this predictable and there will undoubtedly be surprises along the way.
To address this uncertainty, I ran a Monte Carlo Simulation of the tournament.The objective was to identify who are the clear favourites in the tournament (and perhaps giving a value to the probability of winning the tournament). The set up involves using random poisson generator to determine the goal scored, with the mean being the predicted xG value from the GEE model. This simulation was repeated 1,000 times to determine the most probable winner. In the event of a penalty shootout during the knockout stages, a team will be decided at random due to random nature of penalty shootout outcomes.
Below are the results showing the top 10 most frequent winners of the tournament.
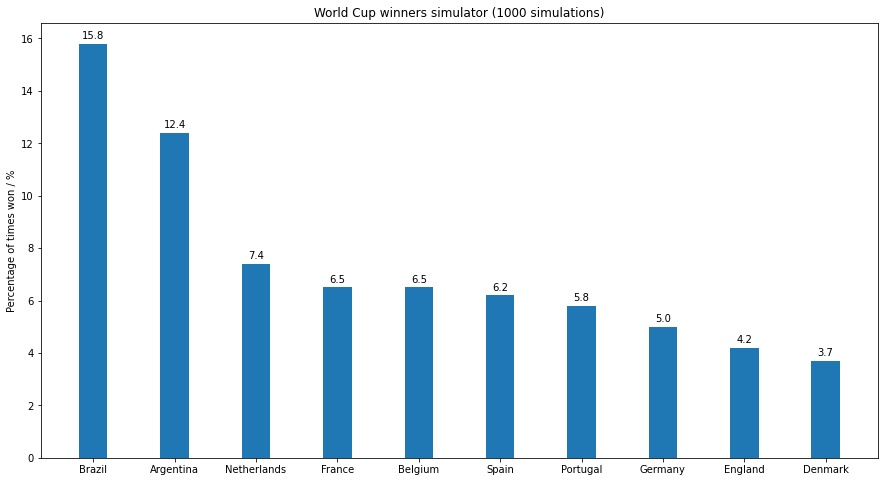
Unsurprisingly again, Brazil turns up to be the favourites, winning the simulated World Cup tournament an approximately 15.8% of the time. Some interesting observations though - Spain who is ranked third best in the Elo Ratings shows up as 6th favourites to win the tournament. Its suffice to say that the clear favourites are the South American heavy weights Brazil and Argentina.
Conclusion
It definitely took some time to research a novel way get to these results and its due to the inspirational work from Vladimir Dzyuba as well as the Elo Ratings provided by eloratings.net. They have served as the basis and source of truth of most of the assumptions made in the model. Football is never predictable but this hopefully should provide an insightful preview of who are the clear favourites of the tournament.
I will be jetting off to Qatar in about 10 days to catch a couple of games myself and will be back to review how well the model has performed in the group stage. If you enjoyed my work and want to reach out, feel free to contact me! Additionally, if you are feeling generous, feel free to buy us a beer here as I will not be getting much of it in Qatar!

